

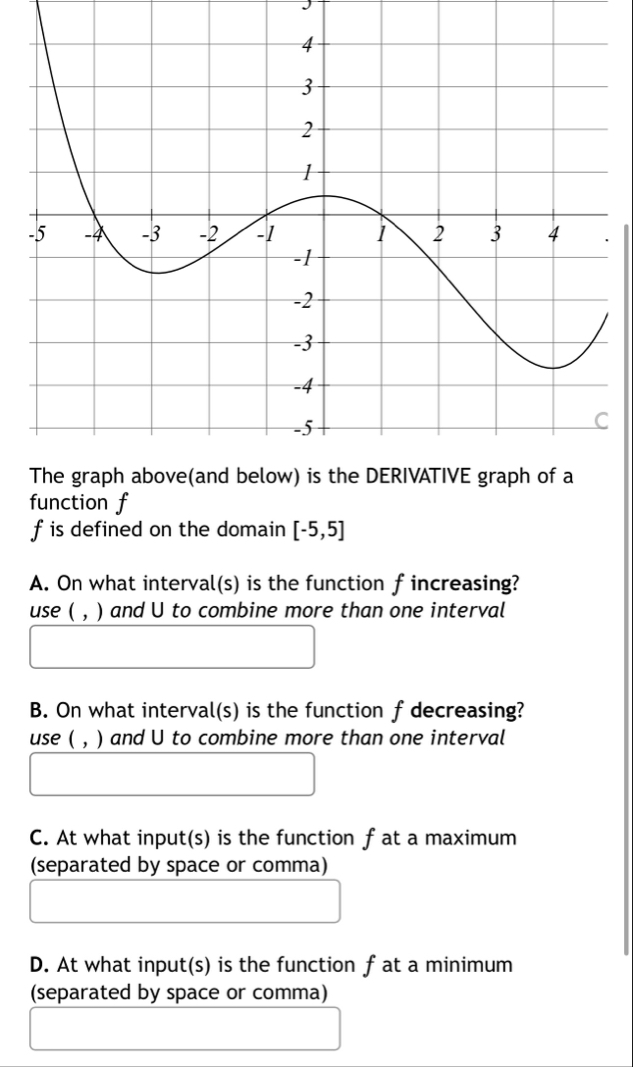
Question: The graph above ( and below ) is the DERIVATIVE graph of a function f f is defined on the domain [ - 5 ,
The graph aboveand below is the DERIVATIVE graph of a function is defined on the domain
A On what intervals is the function increasing? use and U to combine more than one interval
B On what intervals is the function decreasing? use and U to combine more than one interval
C At what inputs is the function at a maximum separated by space or comma
D At what inputs is the function at a minimum separated by space or comma
Objective
In the graph above the slope of the tangent at is
The function graphed above has:
Positive derivative on the intervals
Negative derivative on the intervals
This is the graph of a function
On what interval is the function increasing?
The answer has the form A B
Where and
On what interval is the derivative
The answer has the form A B Where
and
This is the graph of the derivative
The function whose graph you do not see is concave down on the interval
Step by Step Solution
There are 3 Steps involved in it
1 Expert Approved Answer
Step: 1 Unlock

Question Has Been Solved by an Expert!
Get step-by-step solutions from verified subject matter experts
Step: 2 Unlock
Step: 3 Unlock