

Question: The graph below ( Chlorine Demand Curve ) shows the change in chlorine residual as the chlorine dose is increased during the chlorination of a
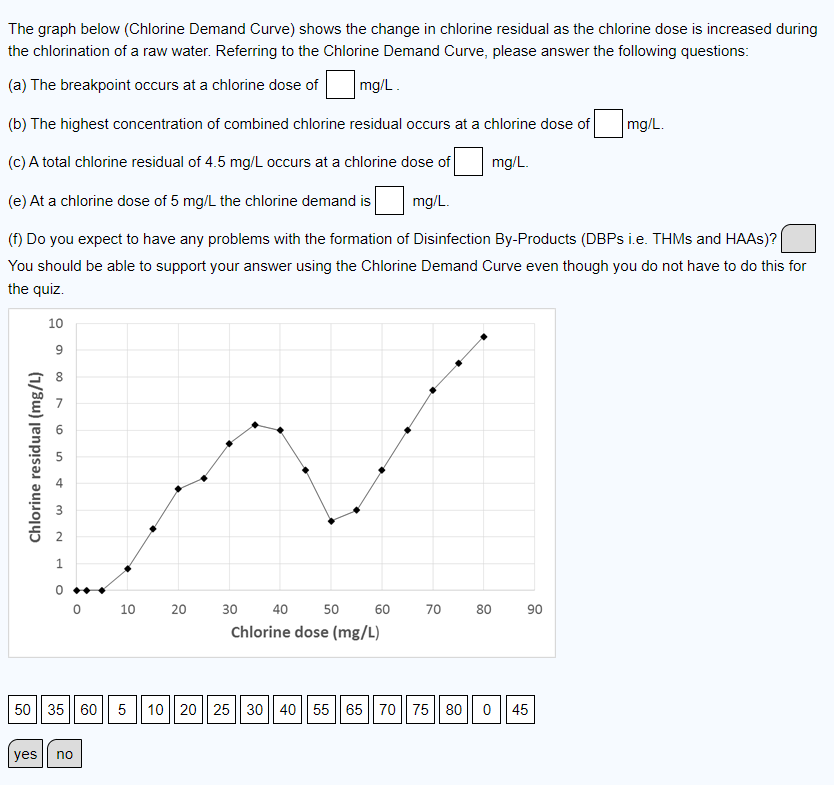
The graph below Chlorine Demand Curve shows the change in chlorine residual as the chlorine dose is increased during
the chlorination of a raw water. Referring to the Chlorine Demand Curve, please answer the following questions:
a The breakpoint occurs at a chlorine dose of
b The highest concentration of combined chlorine residual occurs at a chlorine dose of
c A total chlorine residual of occurs at a chlorine dose of
e At a chlorine dose of the chlorine demand is
f Do you expect to have any problems with the formation of Disinfection ByProducts DBPs ie THMs and HAAs
You should be able to support your answer using the Chlorine Demand Curve even though you do not have to do this for
the quiz.
Step by Step Solution
There are 3 Steps involved in it
1 Expert Approved Answer
Step: 1 Unlock

Question Has Been Solved by an Expert!
Get step-by-step solutions from verified subject matter experts
Step: 2 Unlock
Step: 3 Unlock