

Question: The graph below represents a calibration curve for a liquid in glass thermometer. The height of mercury is shown as a function of temperature. What
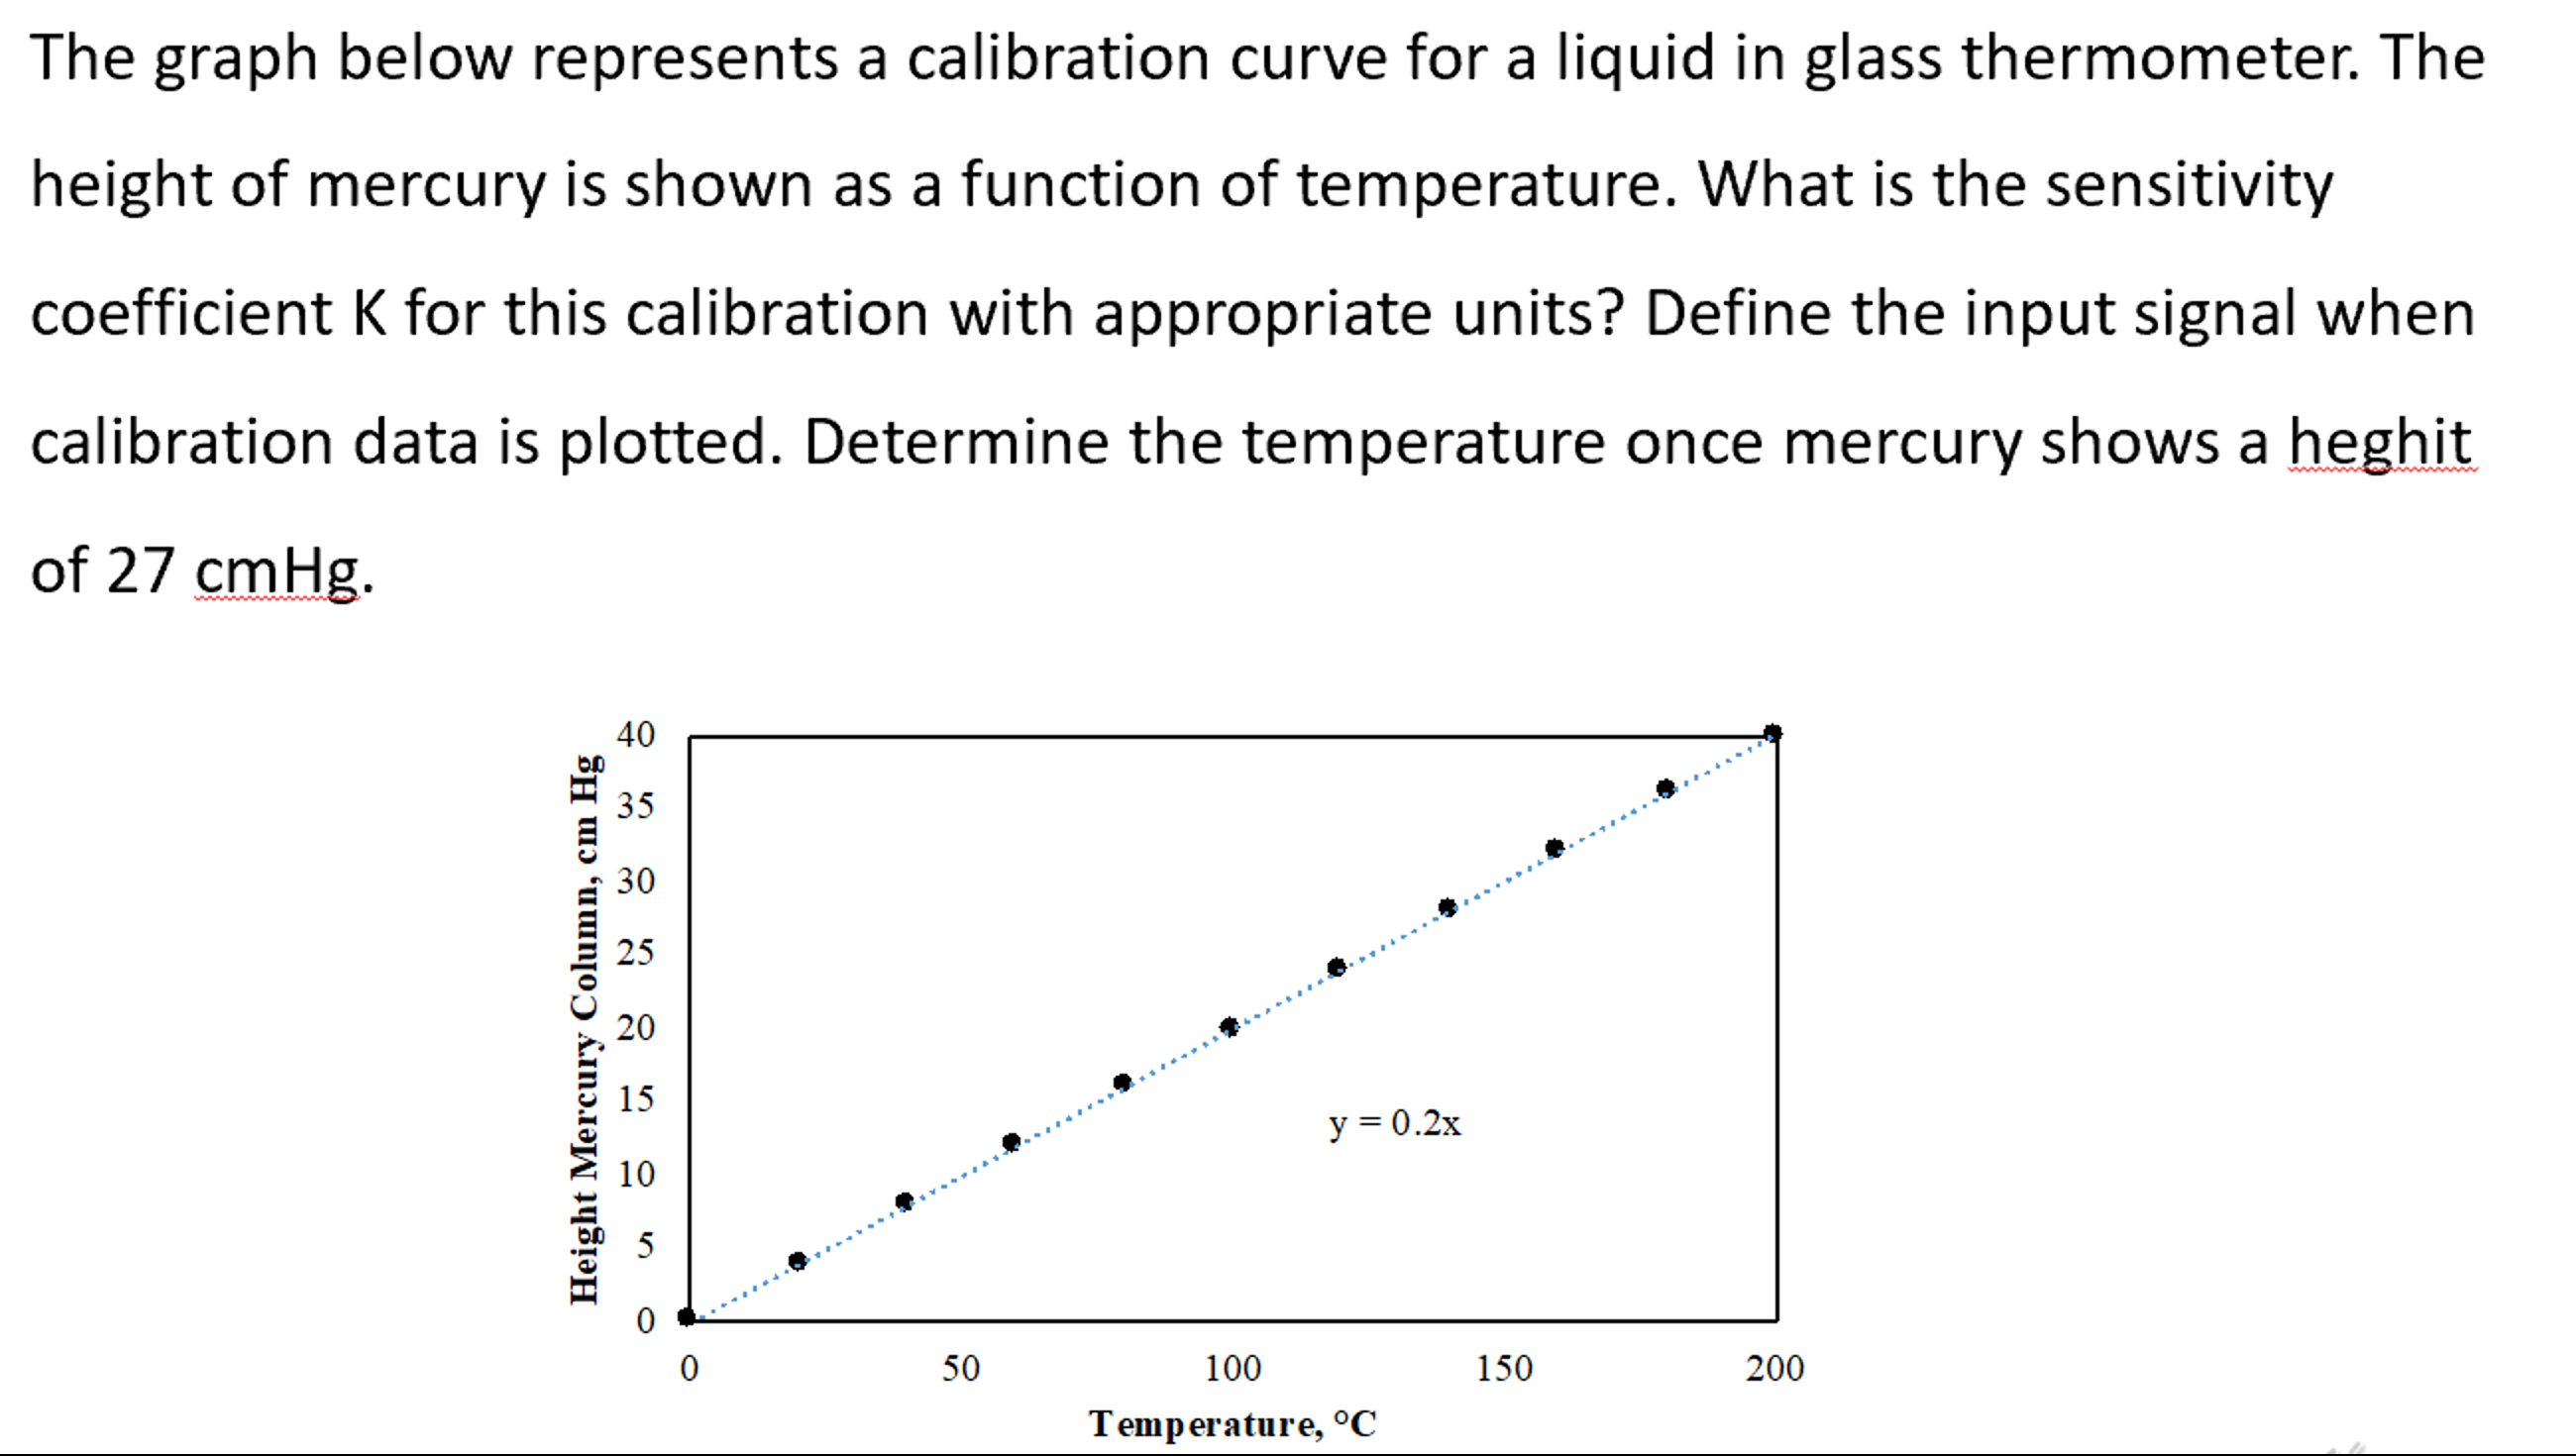
The graph below represents a calibration curve for a liquid in glass thermometer. The height of mercury is shown as a function of temperature. What is the sensitivity coefficient K for this calibration with appropriate units? Define the input signal when calibration data is plotted. Determine the temperature once mercury shows a heghit of cmHg
Step by Step Solution
There are 3 Steps involved in it
1 Expert Approved Answer
Step: 1 Unlock

Question Has Been Solved by an Expert!
Get step-by-step solutions from verified subject matter experts
Step: 2 Unlock
Step: 3 Unlock