

Question: The graph below represents the force applied on a car during a period of time. Force as a Function of Time 25 20 Force (10'
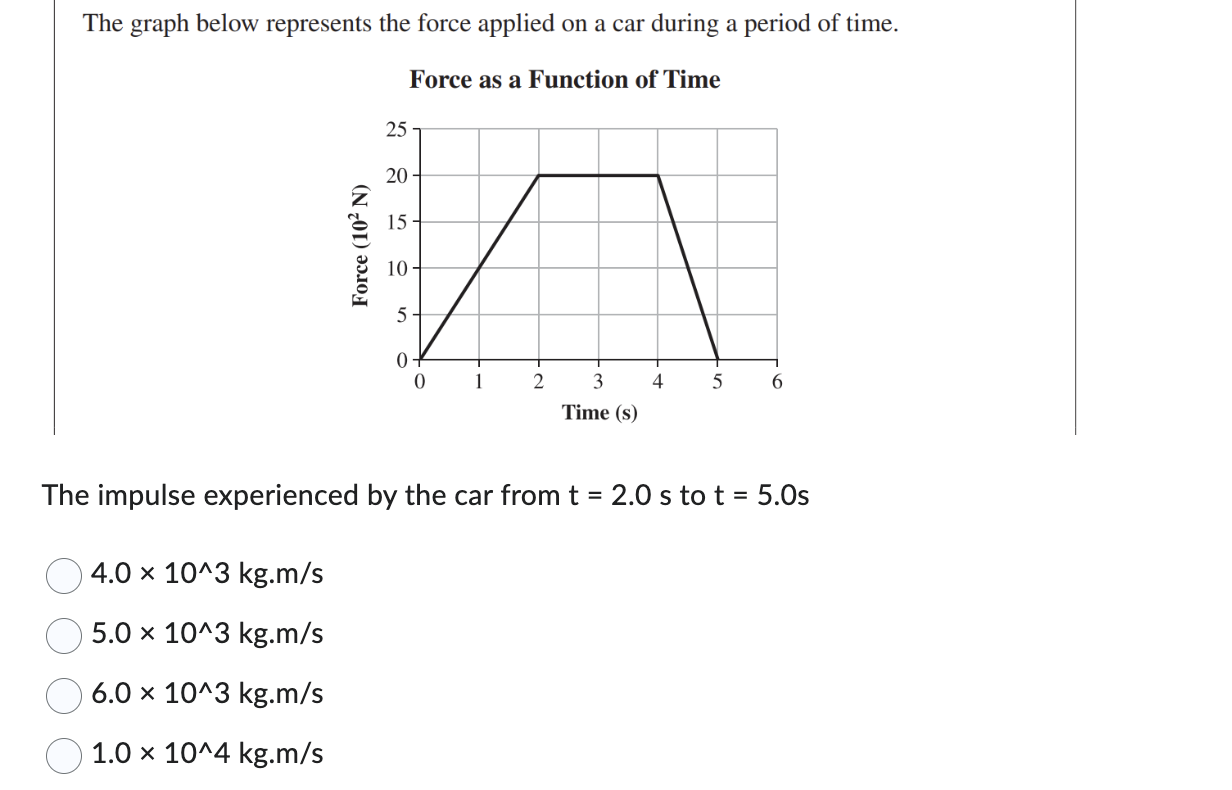
The graph below represents the force applied on a car during a period of time. Force as a Function of Time 25 20 Force (10' N) U S u 2 Time (s) The impulse experienced by the car from t = 2.0 s to t = 5.0s 4.0 x 10^3 kg.m/s 5.0 x 10^3 kg.m/s 6.0 x 10^3 kg.m/s 1.0 x 10^4 kg.m/s
Step by Step Solution
There are 3 Steps involved in it
1 Expert Approved Answer
Step: 1 Unlock

Question Has Been Solved by an Expert!
Get step-by-step solutions from verified subject matter experts
Step: 2 Unlock
Step: 3 Unlock