

Question: The graph below shows DG versus T, as described by the following equation. 40 20 0 AG (kJ/mol) -20 --40 220 320 340 240 260
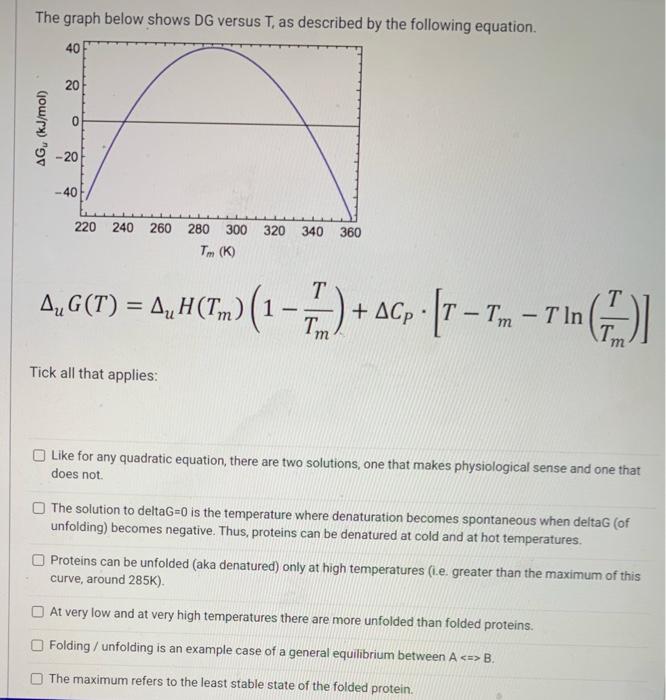
The graph below shows DG versus T, as described by the following equation. 40 20 0 AG (kJ/mol) -20 --40 220 320 340 240 260 280 300 Tm(K) 360 T A,G(T) = 4, H(Tm) (1 - , A, 1-2) - - () A + ACp [T Tm T in Tin ? T = - . Tm m Tick all that applies: Like for any quadratic equation, there are two solutions, one that makes physiological sense and one that does not The solution to deltaG=0 is the temperature where denaturation becomes spontaneous when deltag (of unfolding) becomes negative. Thus, proteins can be denatured at cold and at hot temperatures. Proteins can be unfolded (aka denatured) only at high temperatures (1.e. greater than the maximum of this curve, around 285K) At very low and at very high temperatures there are more unfolded than folded proteins. Folding / unfolding is an example case of a general equilibrium between A B. The maximum refers to the least stable state of the folded protein
Step by Step Solution
There are 3 Steps involved in it

Get step-by-step solutions from verified subject matter experts