

Question: The graph below shows the average ticket price for a show on Broadway for each season from 2009 to 2014. a) Find the average annual
The graph below shows the average ticket price for a show on Broadway for each season from 2009 to 2014.
a) Find the average annual increase from 2009 to 2014.
b) Assuming this trend continued predict the average ticket price for a show on Broadway for the 2017 season.
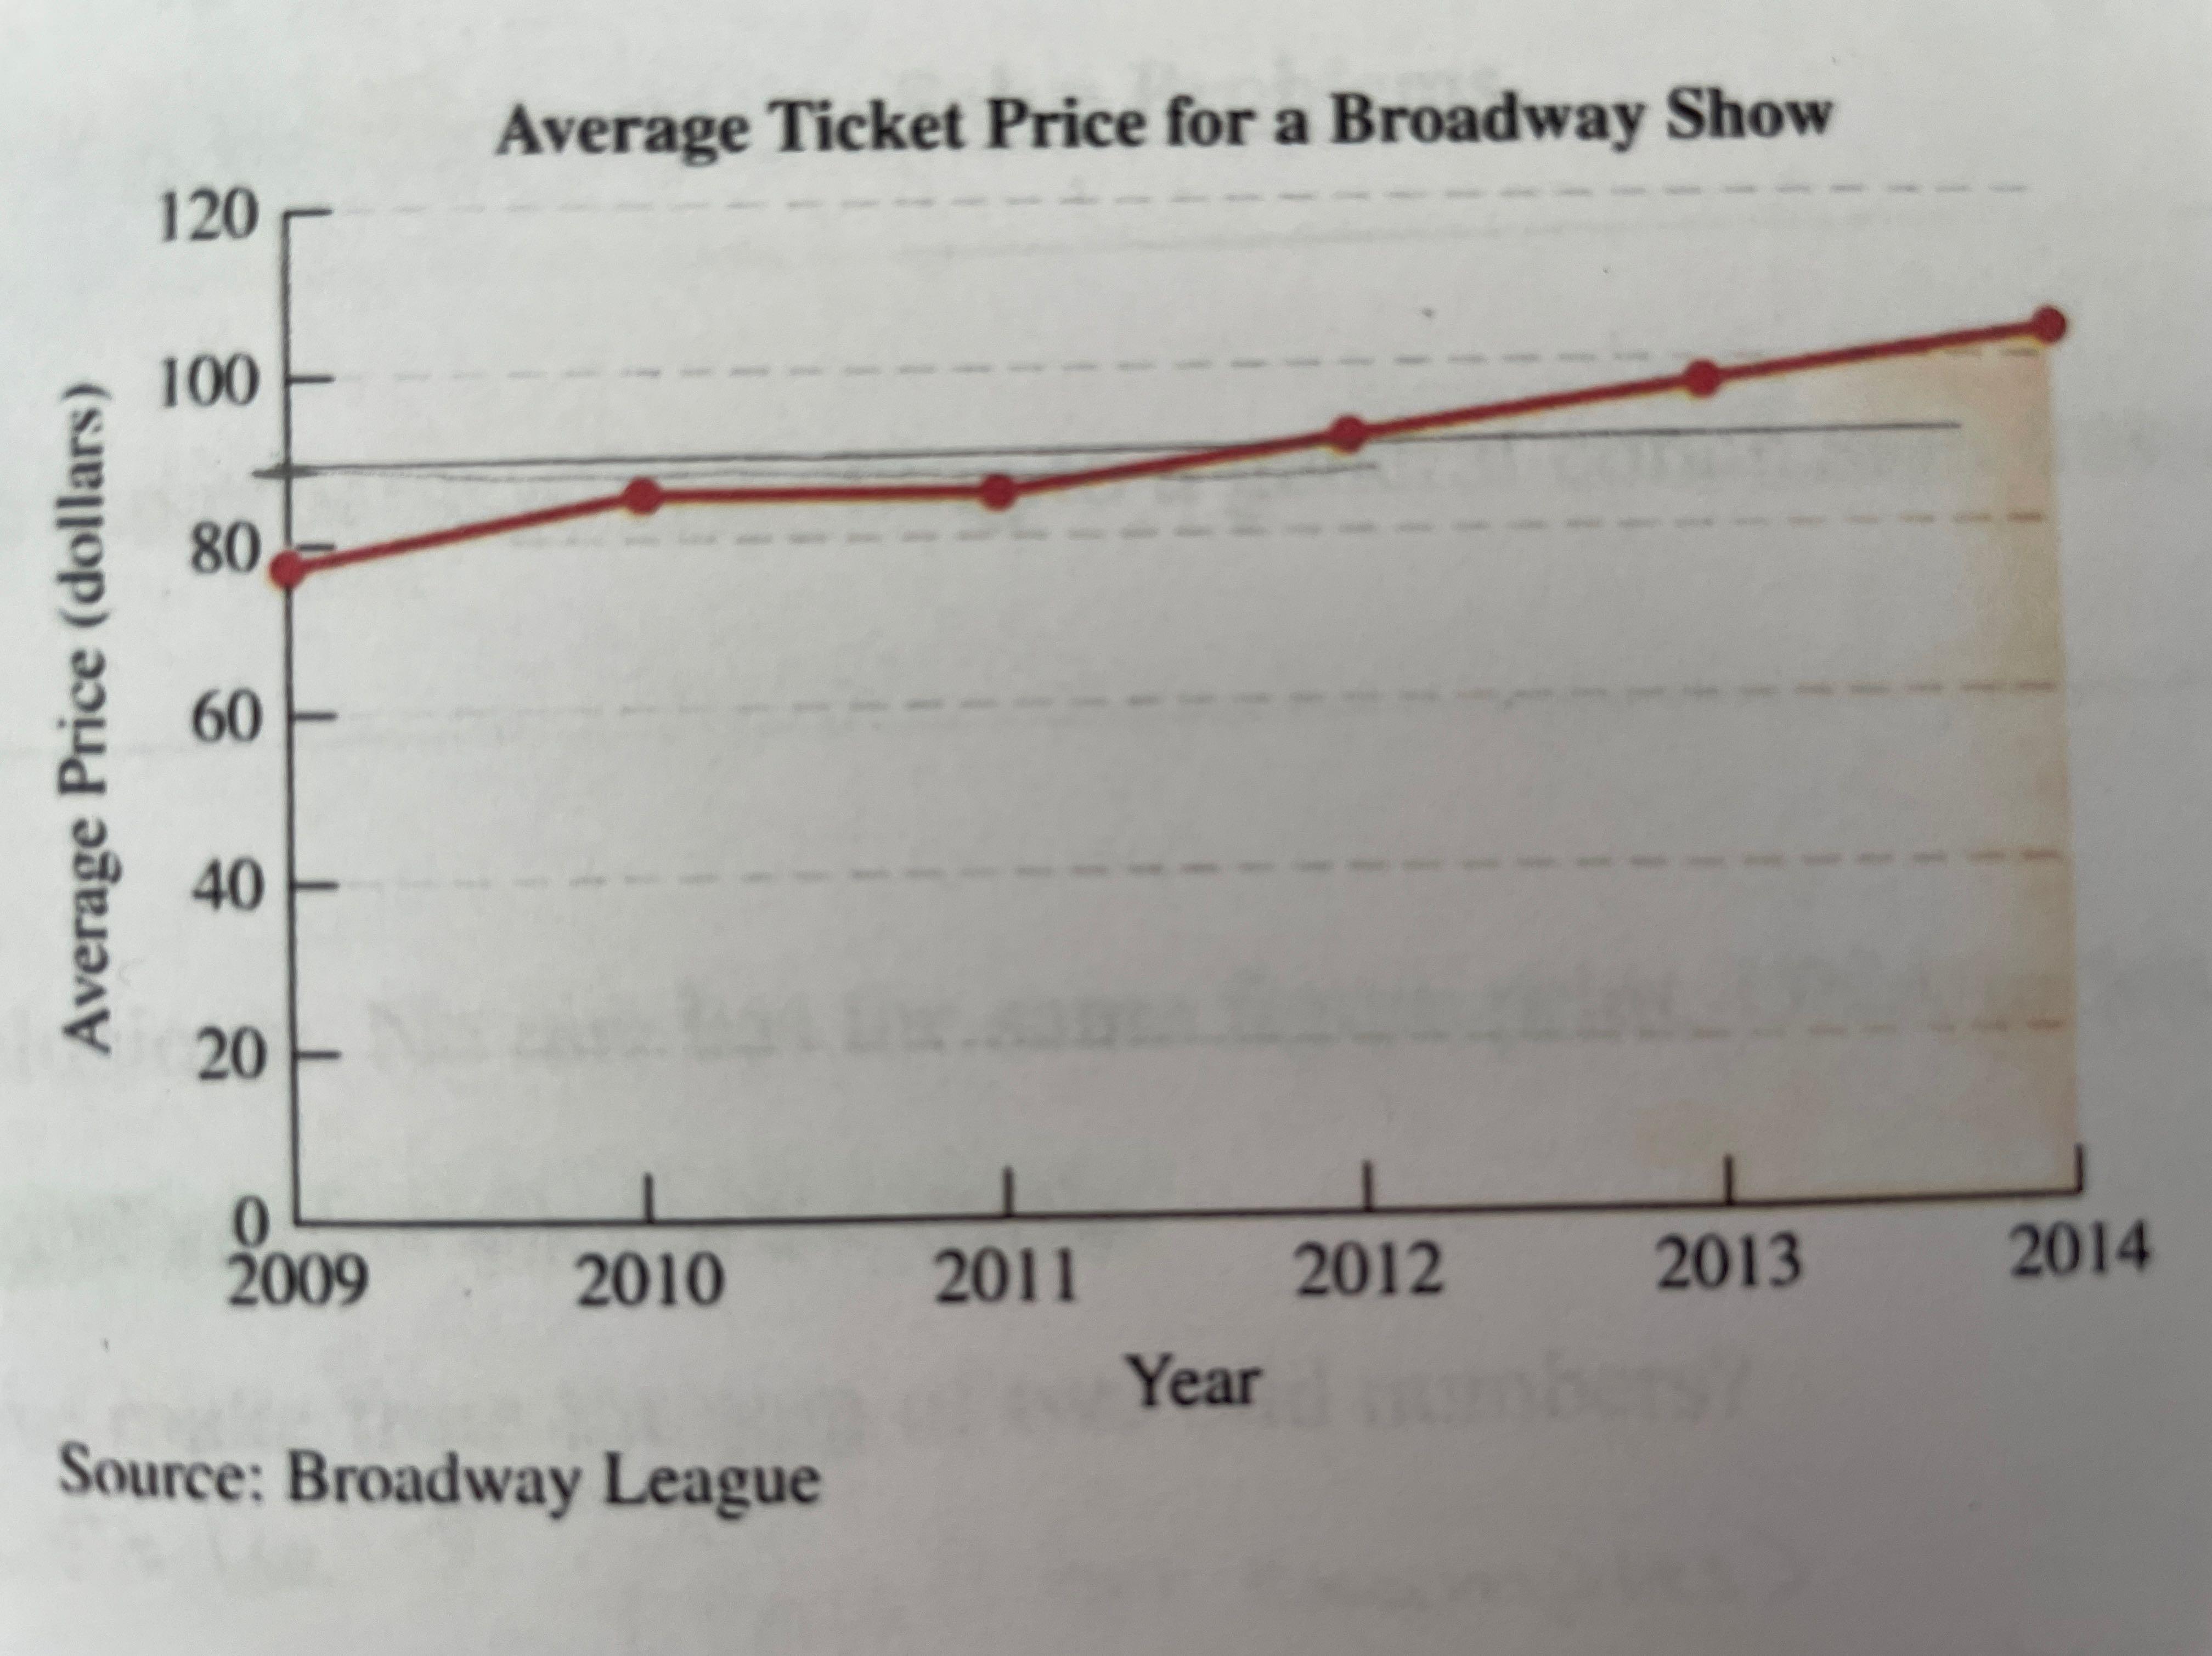
120 100 80 60 40 Average Price (dollars) 20 Average Ticket Price for a Broadway Show 2009 2010 2011 2012 2013 2014 Year Source: Broadway League
Step by Step Solution
There are 3 Steps involved in it
1 Expert Approved Answer
Step: 1 Unlock

Question Has Been Solved by an Expert!
Get step-by-step solutions from verified subject matter experts
Step: 2 Unlock
Step: 3 Unlock