

Question: The graph below was produced after running a factorial ANOVA analysis in STATA. 85% 75% Participants' Face Recognition Accuracy Faces of ethnic in-group 65% members
The graph below was produced after running a factorial ANOVA analysis in STATA.
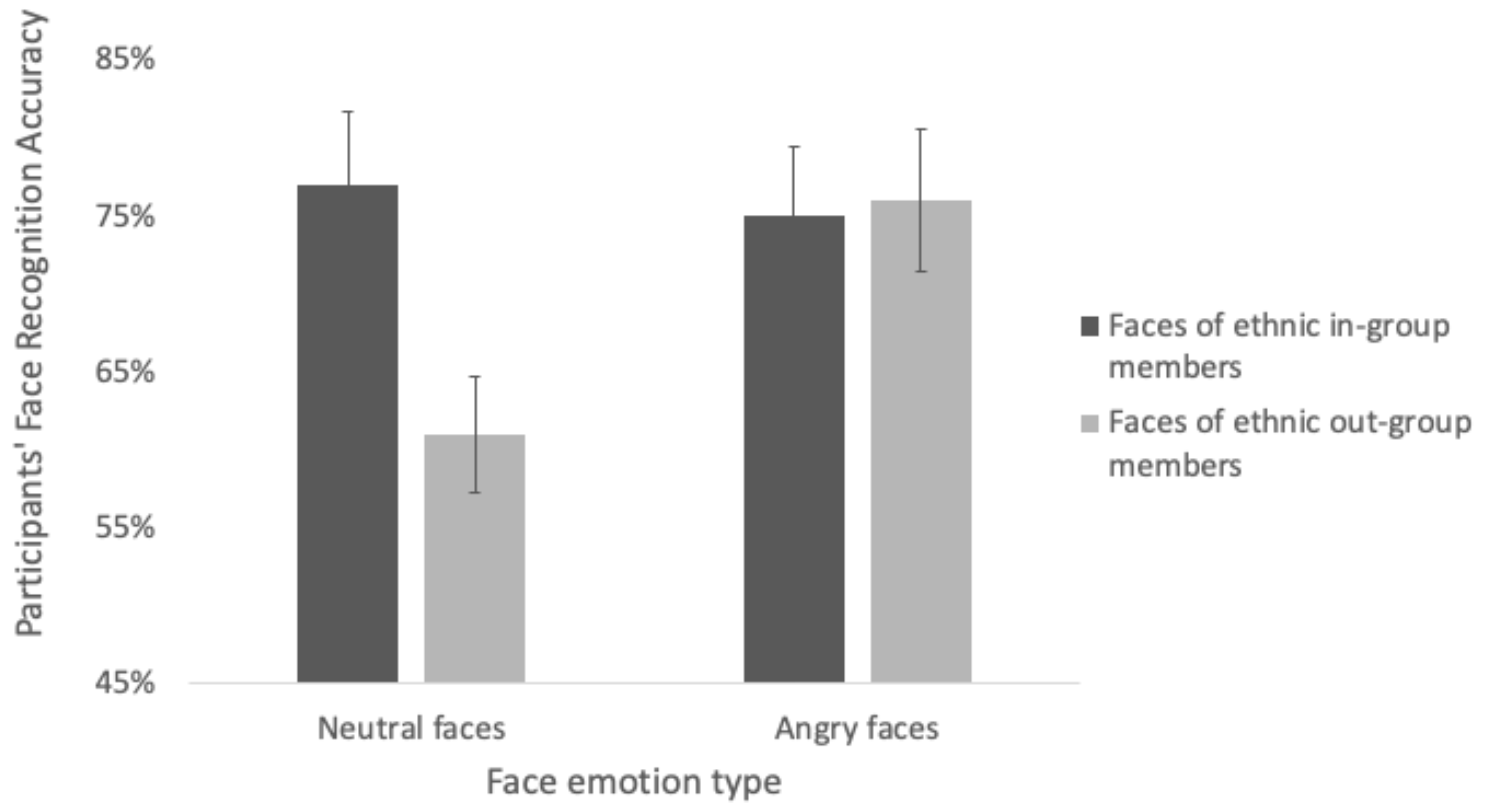
85% 75% Participants' Face Recognition Accuracy Faces of ethnic in-group 65% members Faces of ethnic out-group members 55% i 45% Neutral faces Angry faces Face emotion type
Step by Step Solution
There are 3 Steps involved in it
1 Expert Approved Answer
Step: 1 Unlock

Question Has Been Solved by an Expert!
Get step-by-step solutions from verified subject matter experts
Step: 2 Unlock
Step: 3 Unlock