

Question: The graph given shows the deviation from the average daily temperature for the hours of a given day, with t=0 corresponding to 6AM. (4
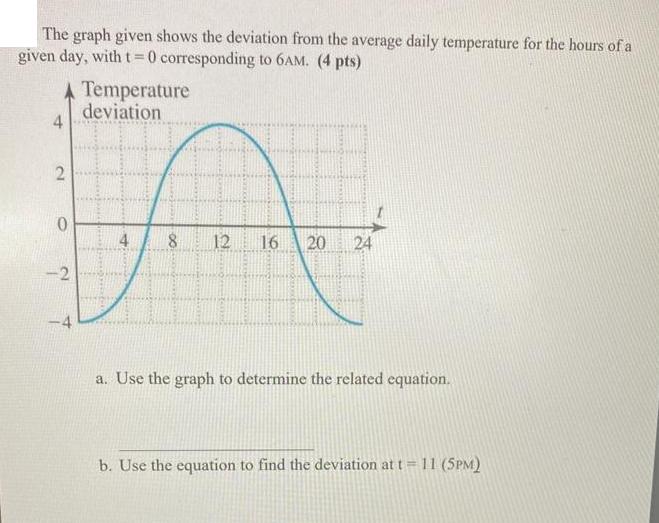
The graph given shows the deviation from the average daily temperature for the hours of a given day, with t=0 corresponding to 6AM. (4 pts) A Temperature deviation 4 2 0 -2 4 8 12 16 20 24 a. Use the graph to determine the related equation. b. Use the equation to find the deviation at t = 11 (5PM)
Step by Step Solution
★★★★★
3.40 Rating (163 Votes )
There are 3 Steps involved in it
1 Expert Approved Answer
Step: 1 Unlock

Question Has Been Solved by an Expert!
Get step-by-step solutions from verified subject matter experts
Step: 2 Unlock
Step: 3 Unlock