

Question: The graph gives the tides at a certain beach, x hours after midnight on a particular day, where 4- OSXS 29. When were water levels
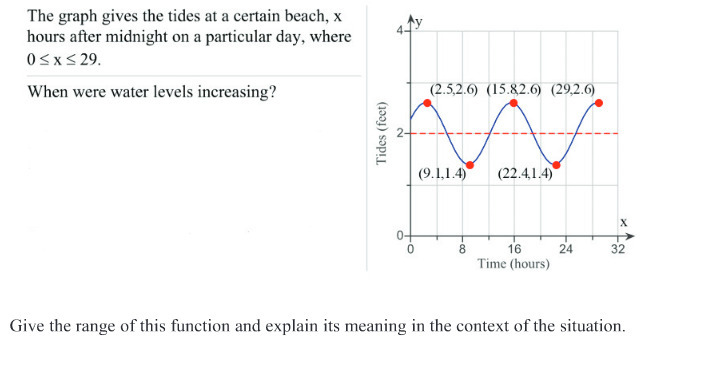
The graph gives the tides at a certain beach, x hours after midnight on a particular day, where 4- OSXS 29. When were water levels increasing? (2.5,2.6) (15.82.6) (29.2.6) Tides (feet) 2 (9.1,1.4) (22.4,1.4) X 0 8 16 24 32 Time (hours) Give the range of this function and explain its meaning in the context of the situation
Step by Step Solution
There are 3 Steps involved in it
1 Expert Approved Answer
Step: 1 Unlock

Question Has Been Solved by an Expert!
Get step-by-step solutions from verified subject matter experts
Step: 2 Unlock
Step: 3 Unlock