

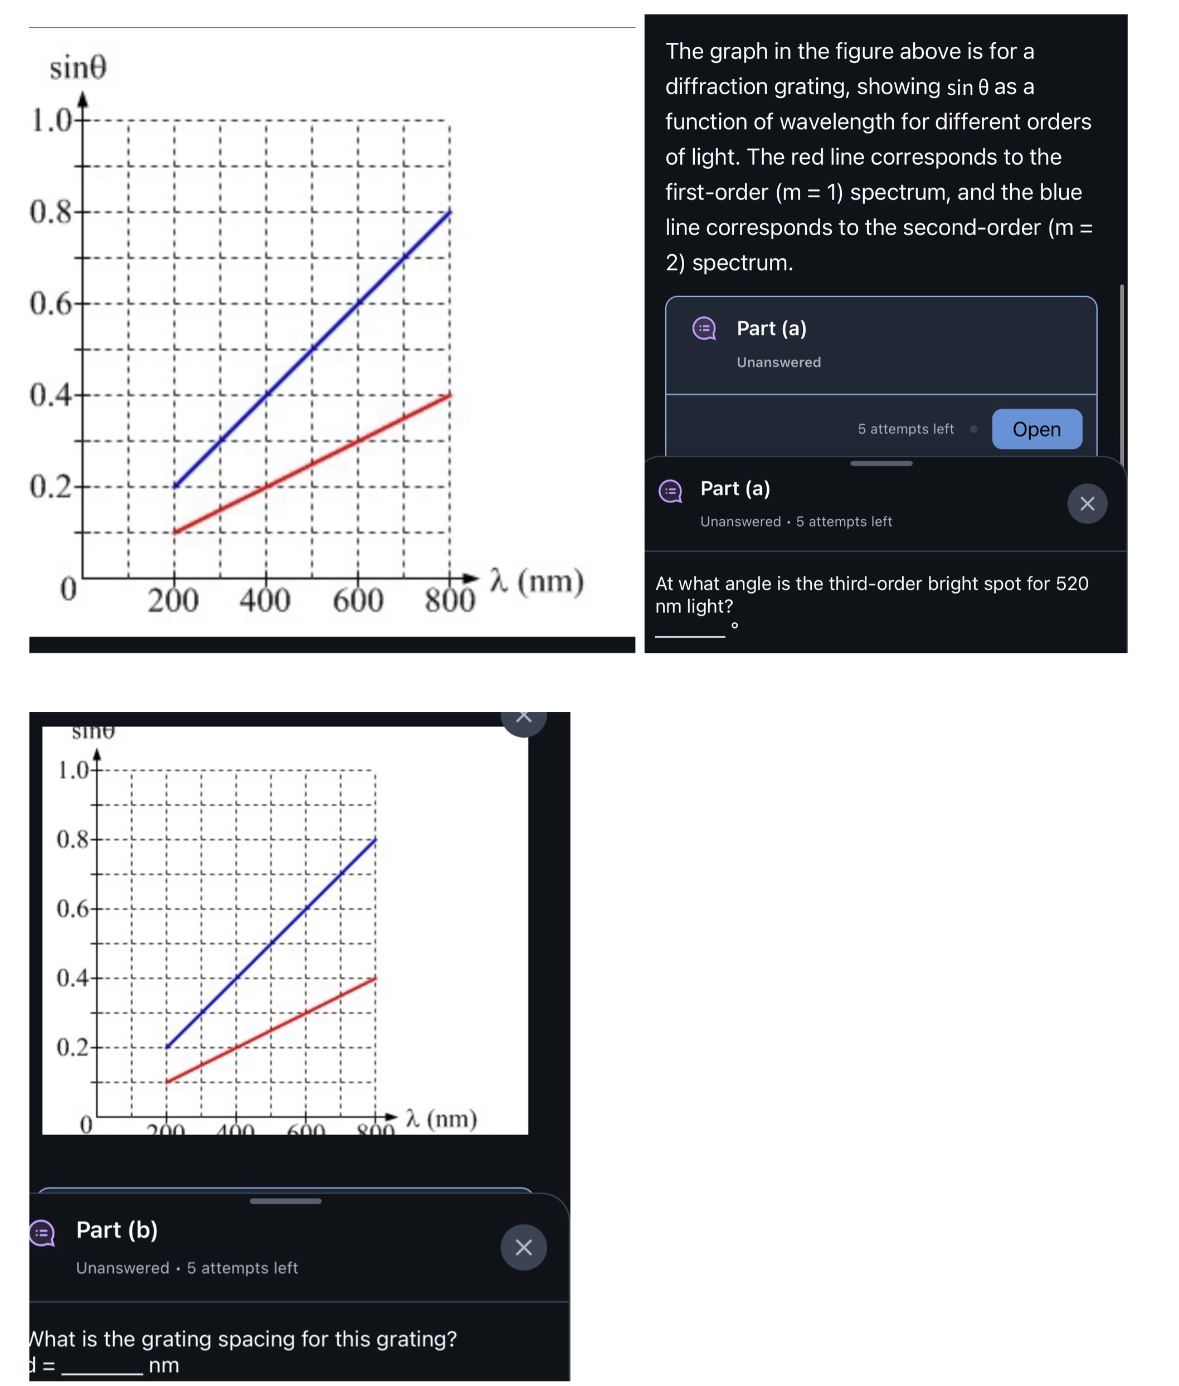
Question: The graph in the figure above is for a diffraction grating, showing s i n as a function of wavelength for different orders of light.
The graph in the figure above is for a diffraction grating, showing as a function of wavelength for different orders of light. The red line corresponds to the firstorder spectrum, and the blue line corresponds to the secondorder spectrum.
Part a
Unanswered
attempts left
Open
Part a
Unanswered attempts left
At what angle is the thirdorder bright spot for nm light?
Part b
Unanswered attempts left
What is the grating spacing for this grating?
dotsnm
Step by Step Solution
There are 3 Steps involved in it
1 Expert Approved Answer
Step: 1 Unlock

Question Has Been Solved by an Expert!
Get step-by-step solutions from verified subject matter experts
Step: 2 Unlock
Step: 3 Unlock