

Question: The graph of a function and its derivative are shown y y=h(x) 2+ x Determine, where applicable a. intervals of increase and decrease, b. local
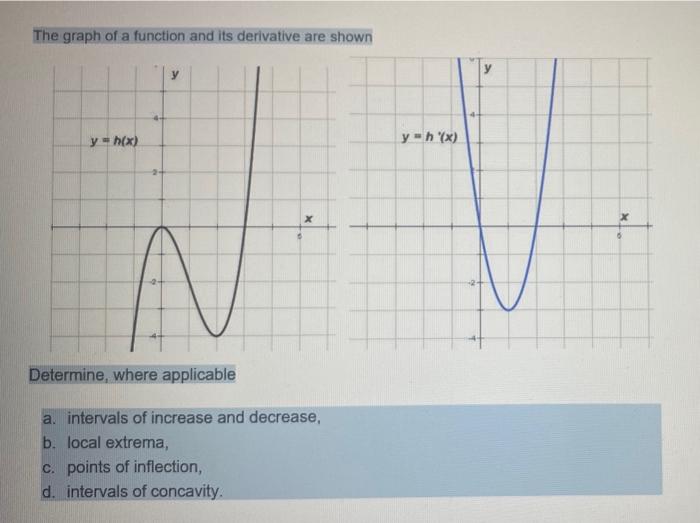
The graph of a function and its derivative are shown y y=h(x) 2+ x Determine, where applicable a. intervals of increase and decrease, b. local extrema, c. points of inflection, d. intervals of concavity. y=h'(x) > x 6
Step by Step Solution
There are 3 Steps involved in it
1 Expert Approved Answer
Step: 1 Unlock

Question Has Been Solved by an Expert!
Get step-by-step solutions from verified subject matter experts
Step: 2 Unlock
Step: 3 Unlock