

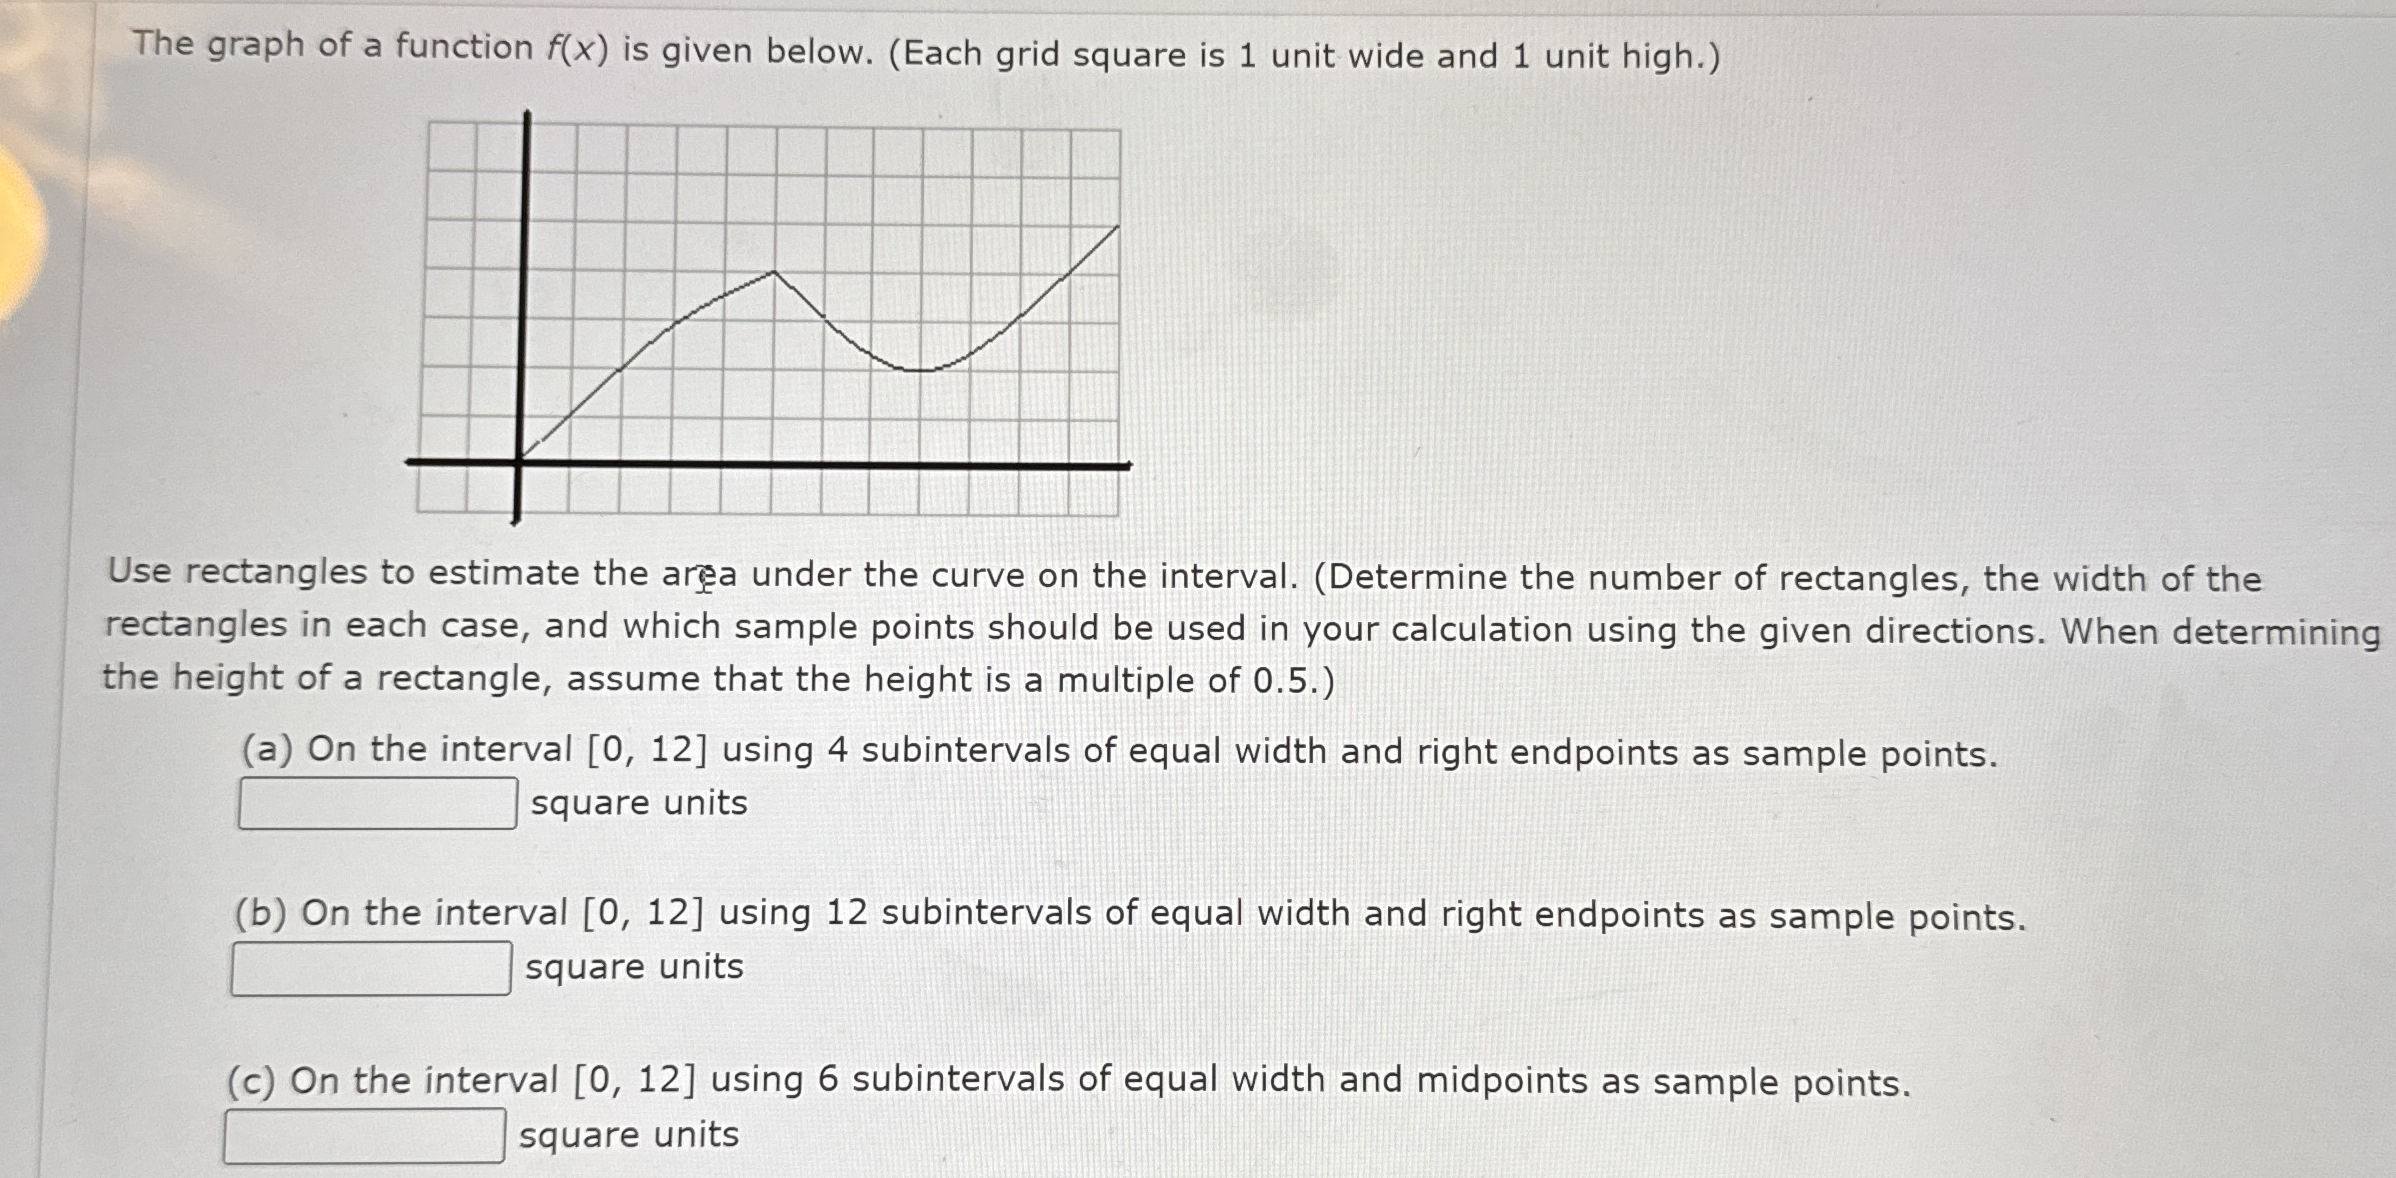
Question: The graph of a function f ( x ) is given below. ( Each grid square is 1 unit wide and 1 unit high. )
The graph of a function is given below. Each grid square is unit wide and unit high.
Use rectangles to estimate the area under the curve on the interval. Determine the number of rectangles, the width of the rectangles in each case, and which sample points should be used in your calculation using the given directions. When determining the height of a rectangle, assume that the height is a multiple of
a On the interval using subintervals of equal width and right endpoints as sample points. square units
b On the interval using subintervals of equal width and right endpoints as sample points. square units
c On the interval using subintervals of equal width and midpoints as sample points. square units
Step by Step Solution
There are 3 Steps involved in it
1 Expert Approved Answer
Step: 1 Unlock

Question Has Been Solved by an Expert!
Get step-by-step solutions from verified subject matter experts
Step: 2 Unlock
Step: 3 Unlock