

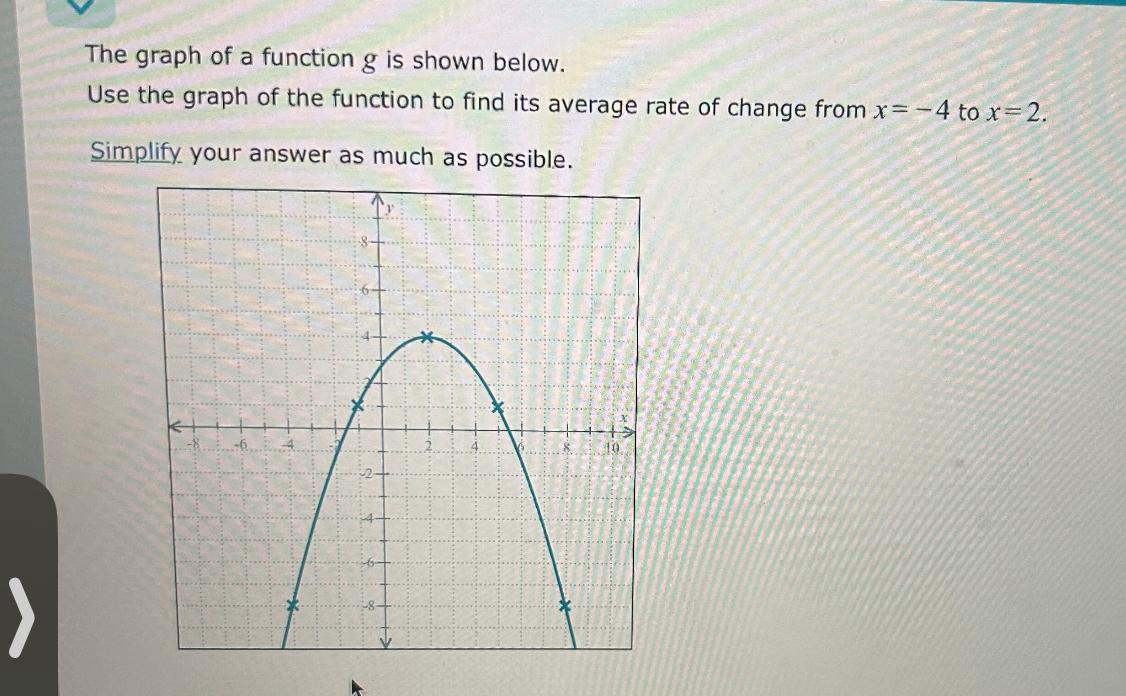
Question: The graph of a function g is shown below. Use the graph of the function to find its average rate of change from x =
The graph of a function is shown below.
Use the graph of the function to find its average rate of change from to
Simplify your answer as much as possible.
Step by Step Solution
There are 3 Steps involved in it
1 Expert Approved Answer
Step: 1 Unlock

Question Has Been Solved by an Expert!
Get step-by-step solutions from verified subject matter experts
Step: 2 Unlock
Step: 3 Unlock