

Question: The graph of a function g is shown below. Use the graph of the function to find its average rate of change from x =

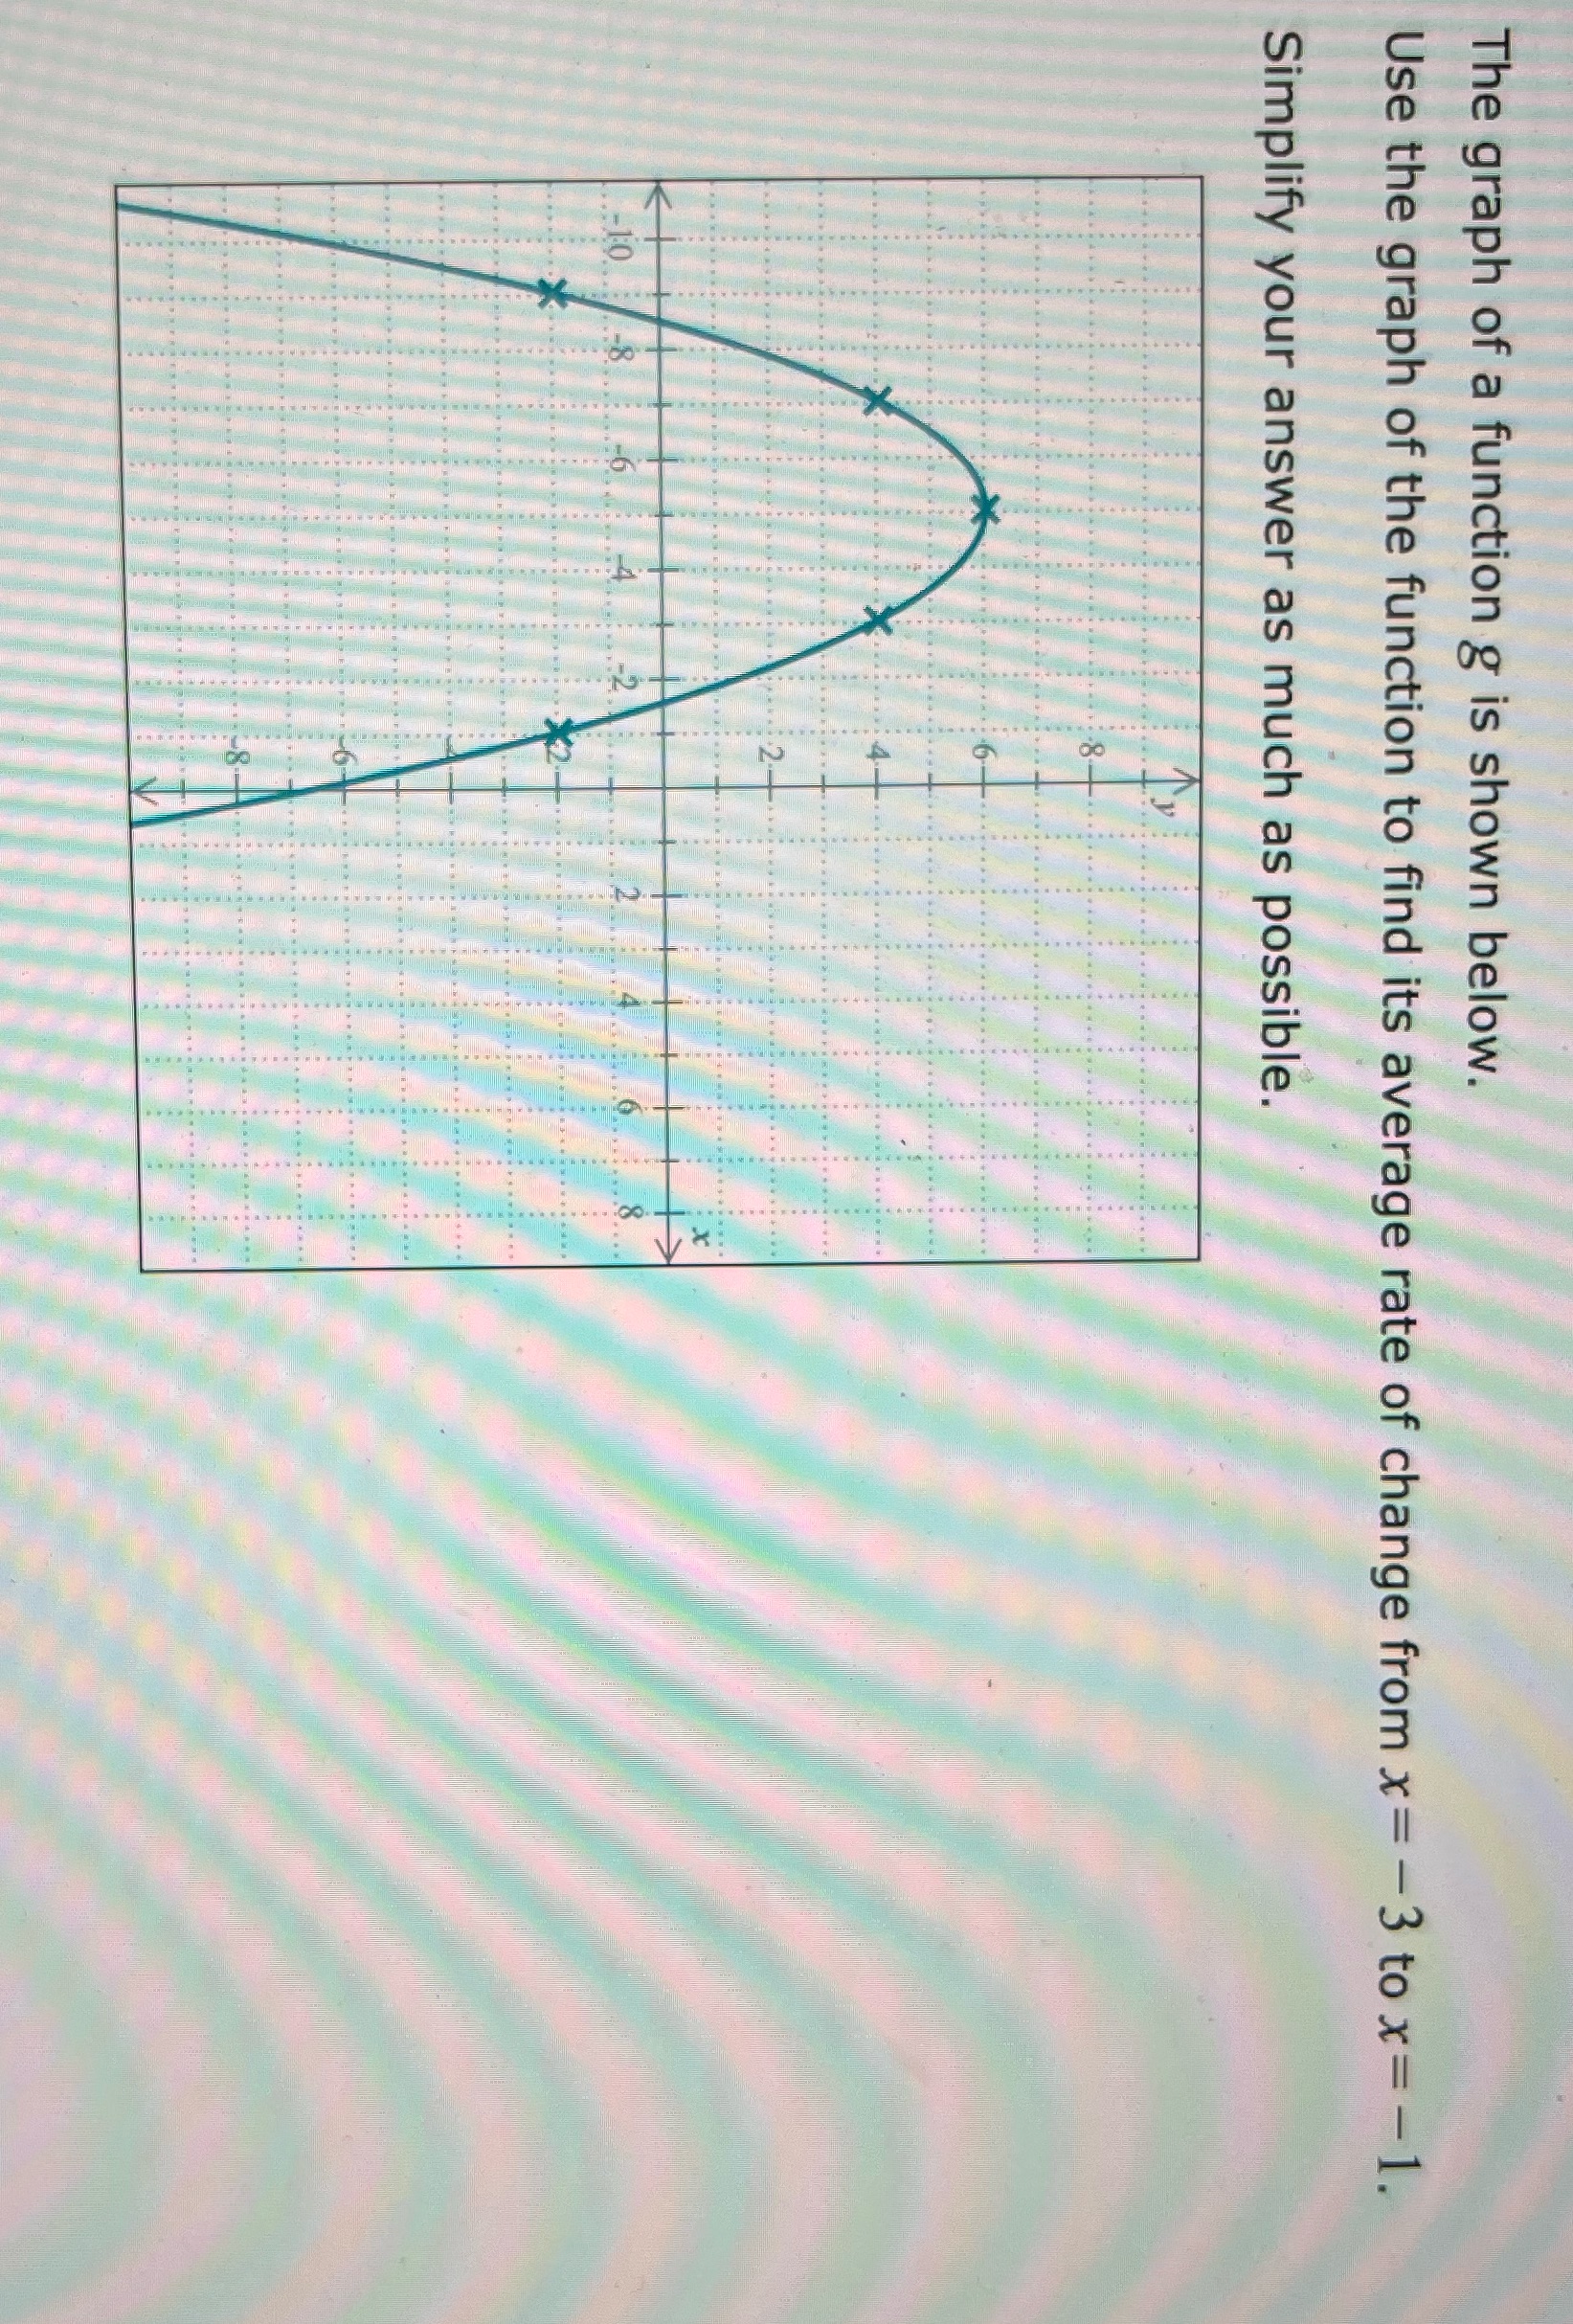
The graph of a function g is shown below. Use the graph of the function to find its average rate of change from x = - 3 to x = - 1. Simplify your answer as much as possible. . . . . . . ... . ...... . .games. . four X
Step by Step Solution
There are 3 Steps involved in it
1 Expert Approved Answer
Step: 1 Unlock

Question Has Been Solved by an Expert!
Get step-by-step solutions from verified subject matter experts
Step: 2 Unlock
Step: 3 Unlock