

Question: The graph of a function g is shown below. Use the graph of the function to find its average rate of change from x =
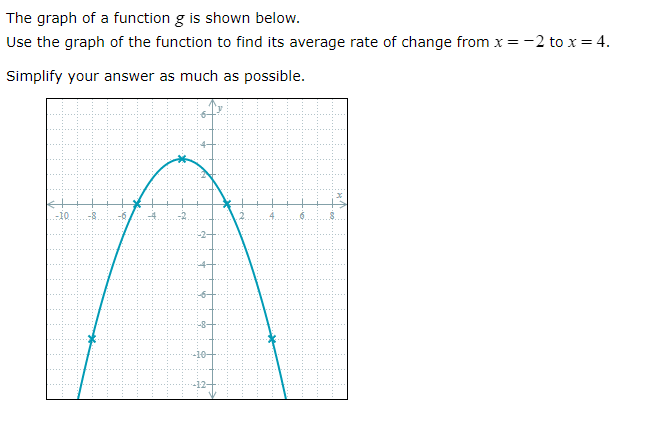
The graph of a function g is shown below. Use the graph of the function to find its average rate of change from x = -2 to x = 4. Simplify your answer as much as possible. :. . . . . . . . . . . . . .. . .. . ... ..... . . . . . .. ..". . .. . . . . . . . .. . . . . . . . . . . . . . . . . . . . . . . . . . . . ." .. .. .. ... . .... . .F 1 . . . . . . . . . . .. 1. . . . ... . . . . . . . . . . . .. .: . . . .. . . . . . . . ." . . . . . . . . . . .. C. . . . . ... . . . . . . . . . . ..:. .:. . . ... . . . . . .... . . . . . . . . . . . . ...:.... . . .. . . . . . . . . . . . . . . . . . . . . . ..... . ... . . . . . . . . . . . . . . . . . . . . . . . . . . . . . . . . . . . . . . . . . . . . . . . . . . :... . . . . . . . . . . . . . . . . . . .. . . . . . . 1 . . . . . . .. . . . . . . . . . . . . . . . . . .. . . . . . . . . . . . . . . . . . . . . .. . . .
Step by Step Solution
There are 3 Steps involved in it

Get step-by-step solutions from verified subject matter experts