

Question: The graph of a function y = f(.'l?) is shown below. In this problem, you will need to estimate unction values from the graph. 51

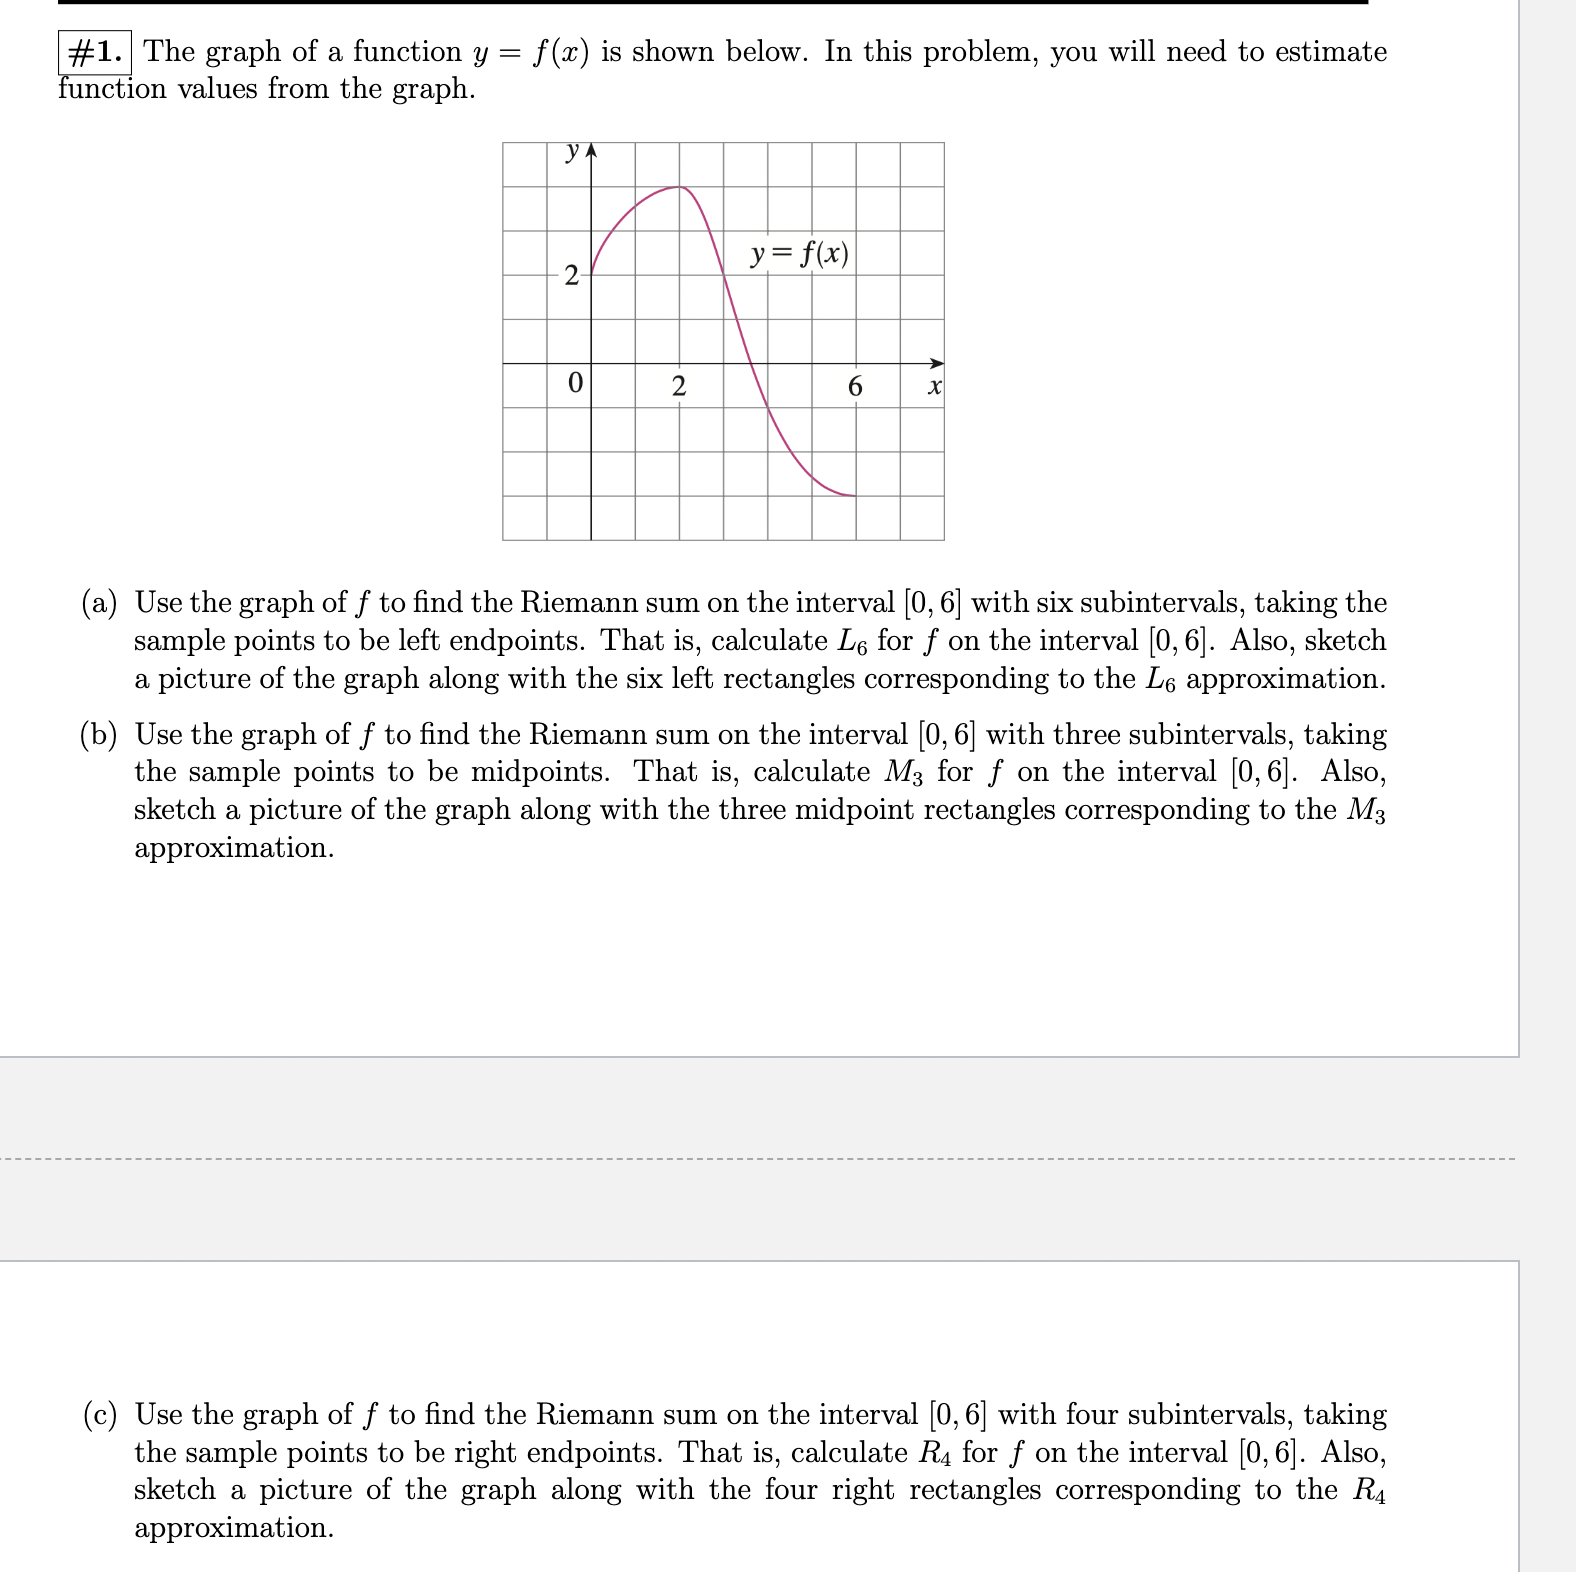
The graph of a function y = f(.'l?) is shown below. In this problem, you will need to estimate unction values from the graph. 51\" (a) Use the graph of f to nd the Riemann sum on the interval [0,6] with six subintervals, taking the sample points to be left endpoints. That is, calculate L6 for f on the interval [0, 6]. Also, sketch a picture of the graph along with the six left rectangles corresponding to the L5 approximation. (b) Use the graph of f to nd the Riemann sum on the interval [0,6] with three subintervals, taking the sample points to be midpoints. That is, calculate M3 for f on the interval [0,6]. Also, sketch a picture of the graph along with the three midpoint rectangles corresponding to the M3 approximation. (c) Use the graph of f to nd the Riemann sum on the interval [0,6] with four subintervals, taking the sample points to be right endpoints. That is, calculate R4 for f on the interval [0,6]. Also, sketch a picture of the graph along with the four right rectangles corresponding to the R4 approximation
Step by Step Solution
There are 3 Steps involved in it

Get step-by-step solutions from verified subject matter experts