

Question: The graph of the function f is given. 32 24 y = f( x) 16 8 0 8 16 24 32 40 48 (a) Use
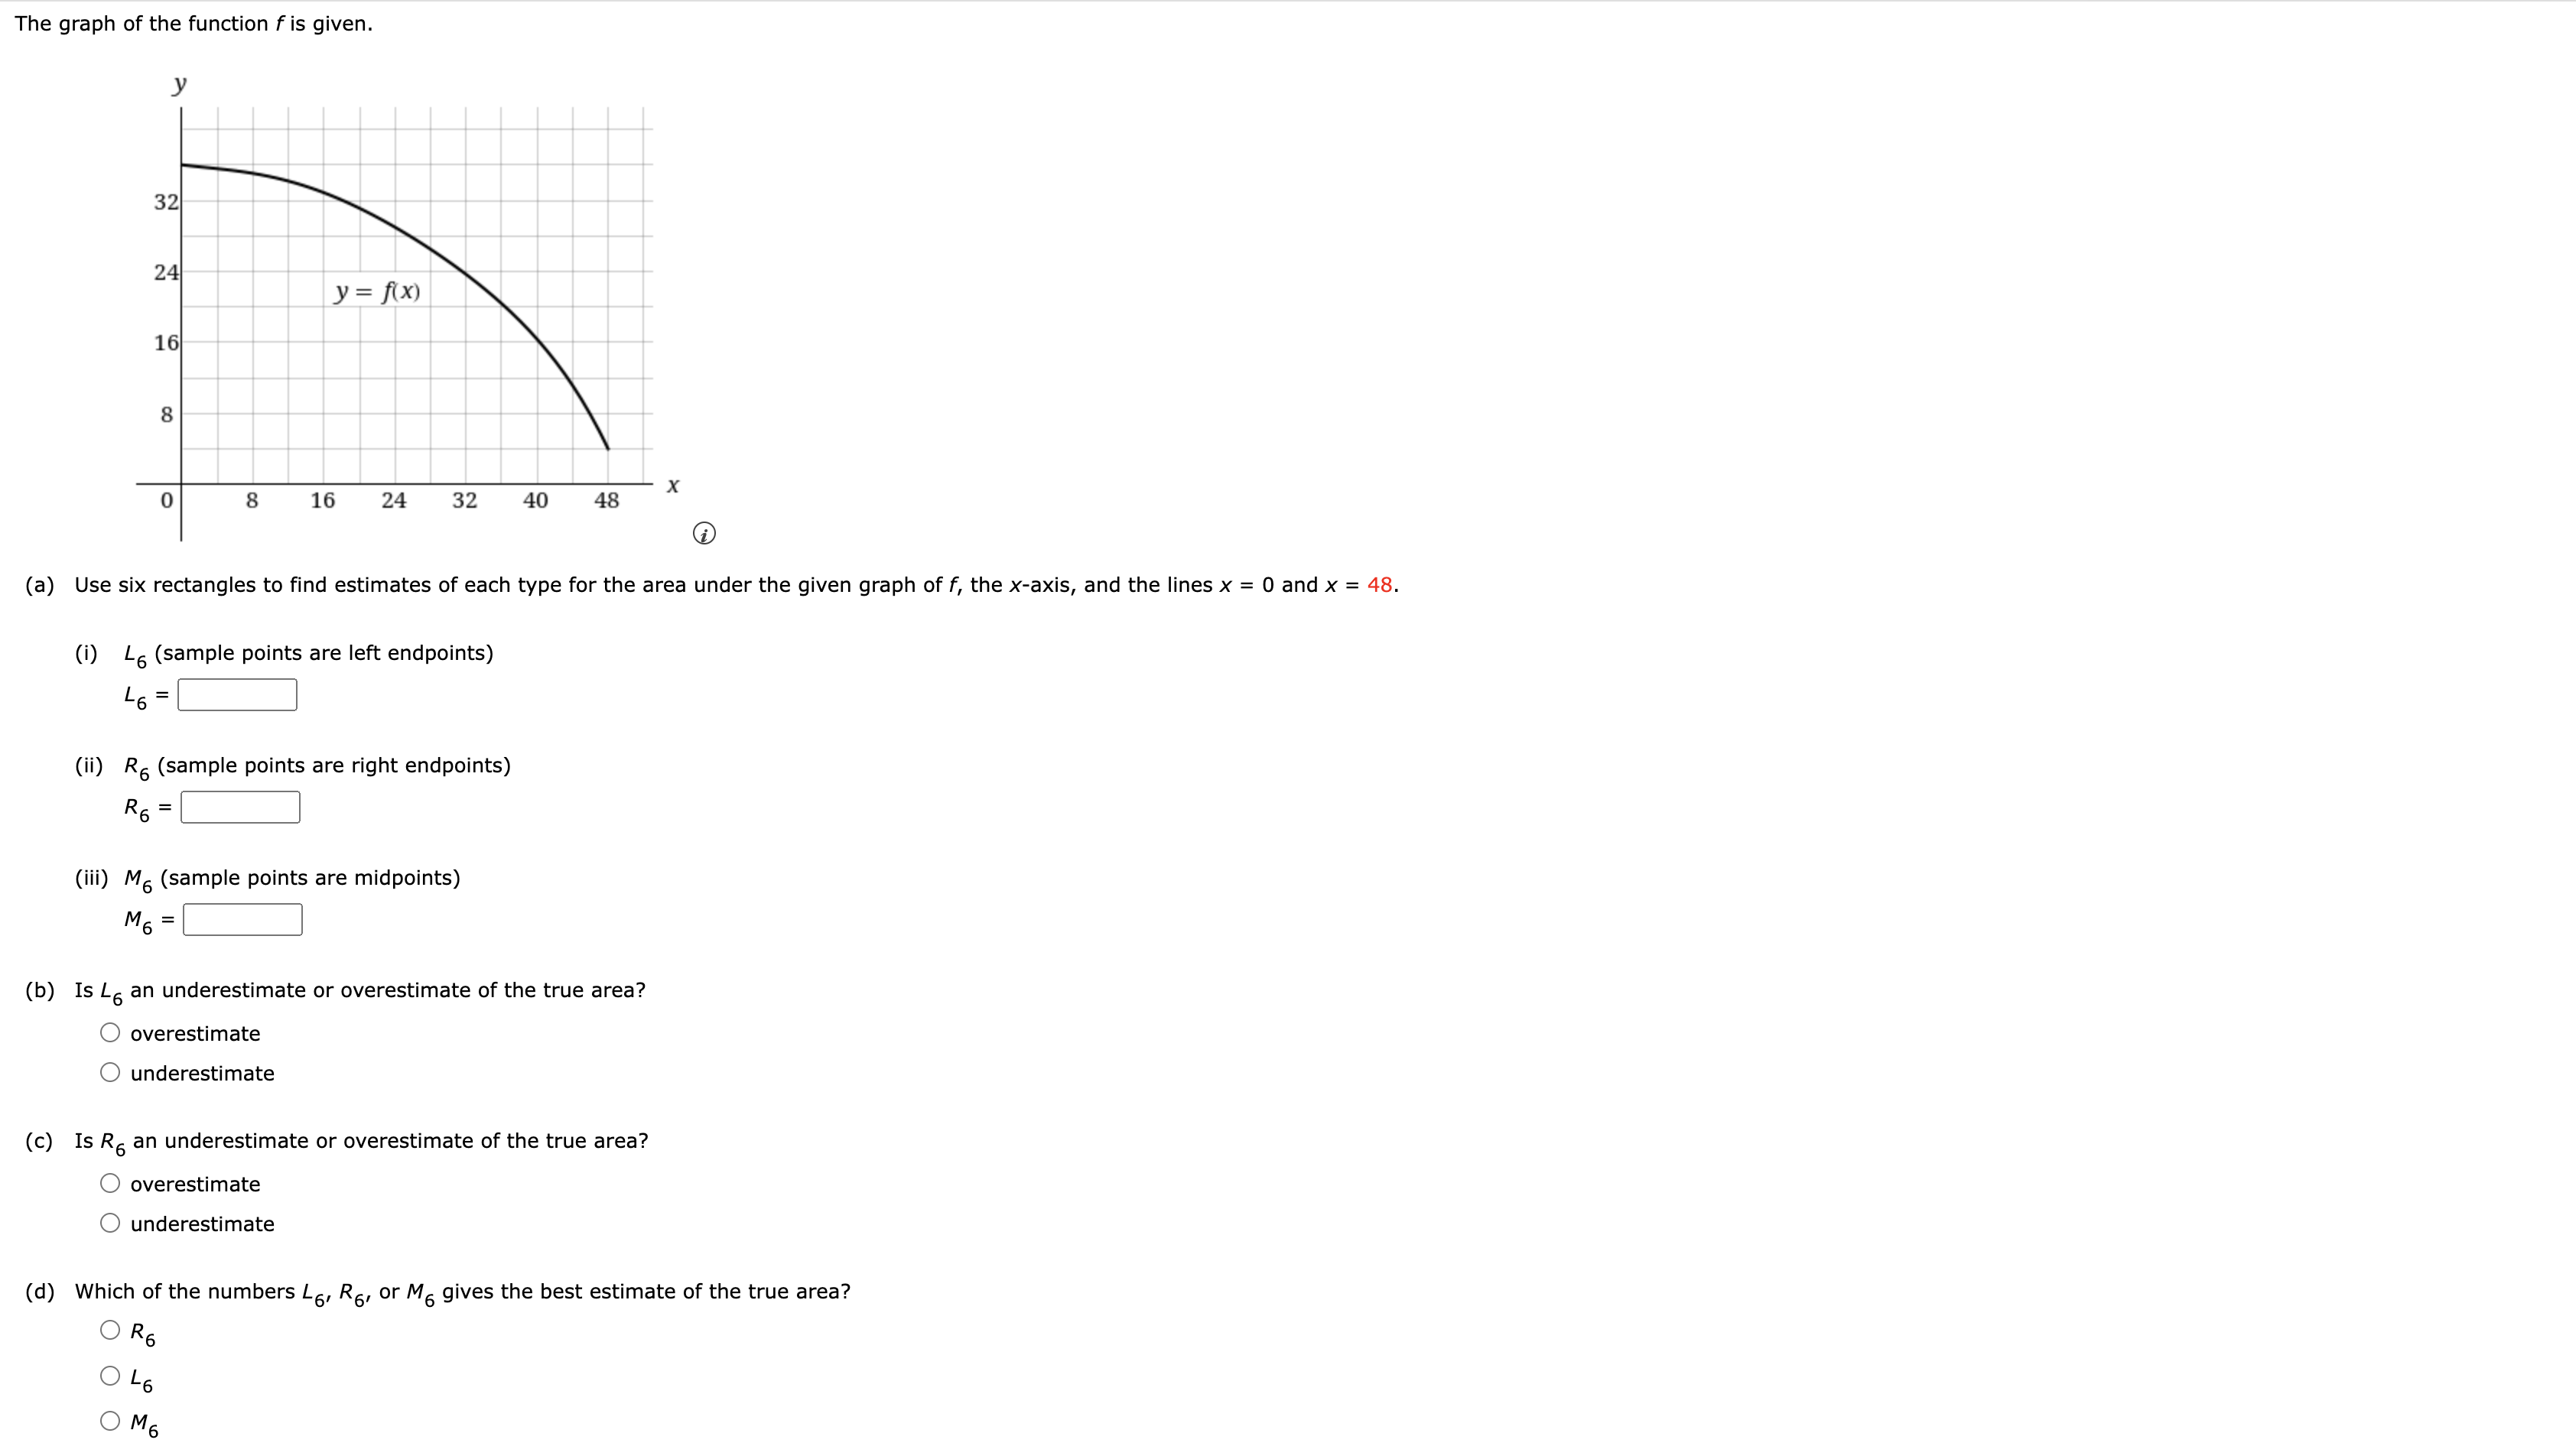
The graph of the function f is given. 32 24 y = f( x) 16 8 0 8 16 24 32 40 48 (a) Use six rectangles to find estimates of each type for the area under the given graph of f, the x-axis, and the lines x = 0 and x = 48. (i) L6 (sample points are left endpoints) L6 (ii) R6 (sample points are right endpoints) R6 = (iii) M6 (sample points are midpoints) M6 = (b) Is L6 an underestimate or overestimate of the true area? overestimate underestimate (c) Is R6 an underestimate or overestimate of the true area? overestimate O underestimate (d) Which of the numbers L6, R6, or Mo gives the best estimate of the true area? OR6 OL6 OMG
Step by Step Solution
There are 3 Steps involved in it
1 Expert Approved Answer
Step: 1 Unlock

Question Has Been Solved by an Expert!
Get step-by-step solutions from verified subject matter experts
Step: 2 Unlock
Step: 3 Unlock