

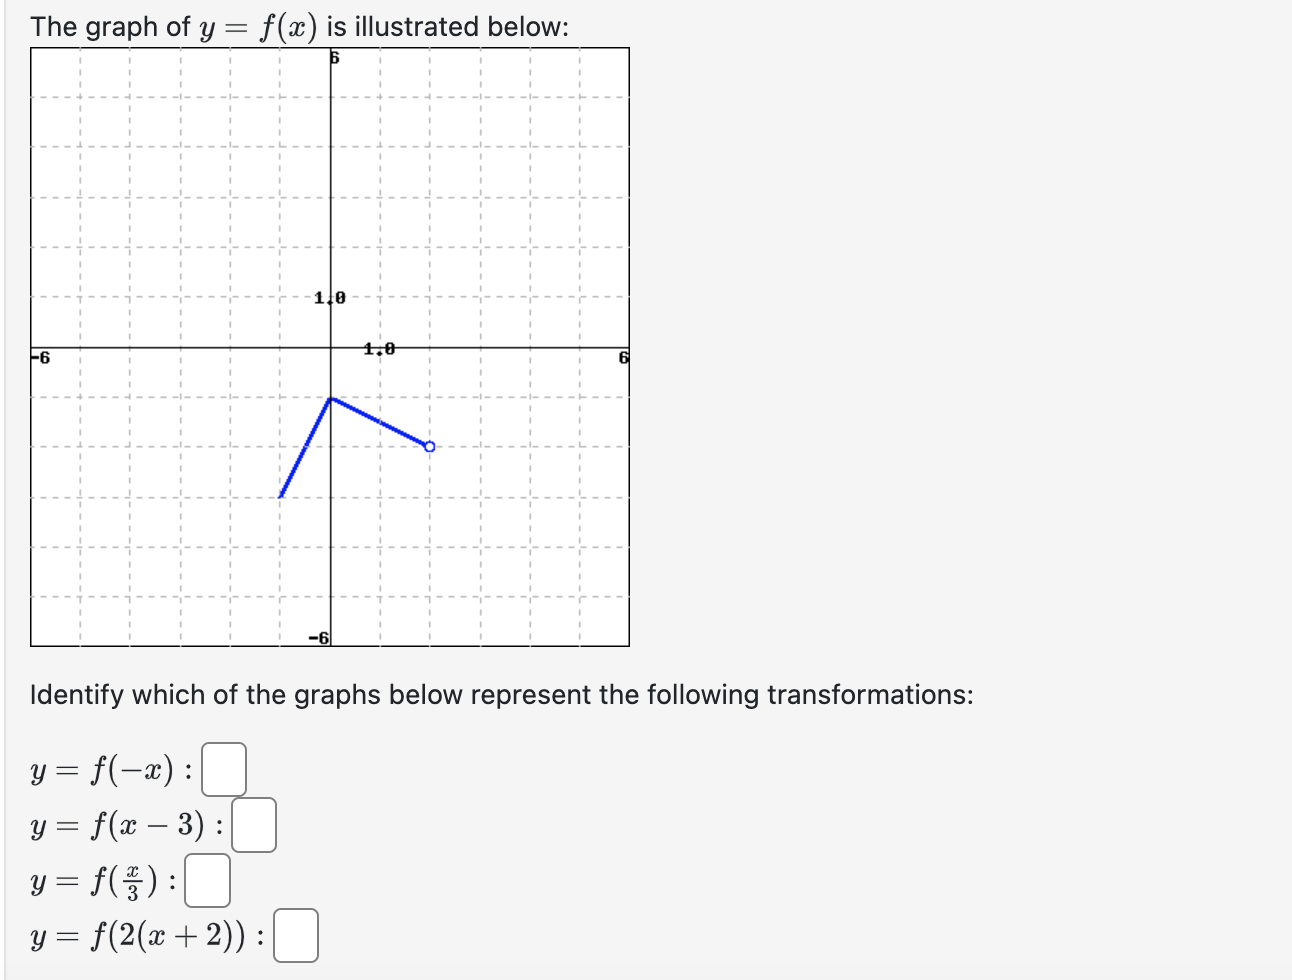
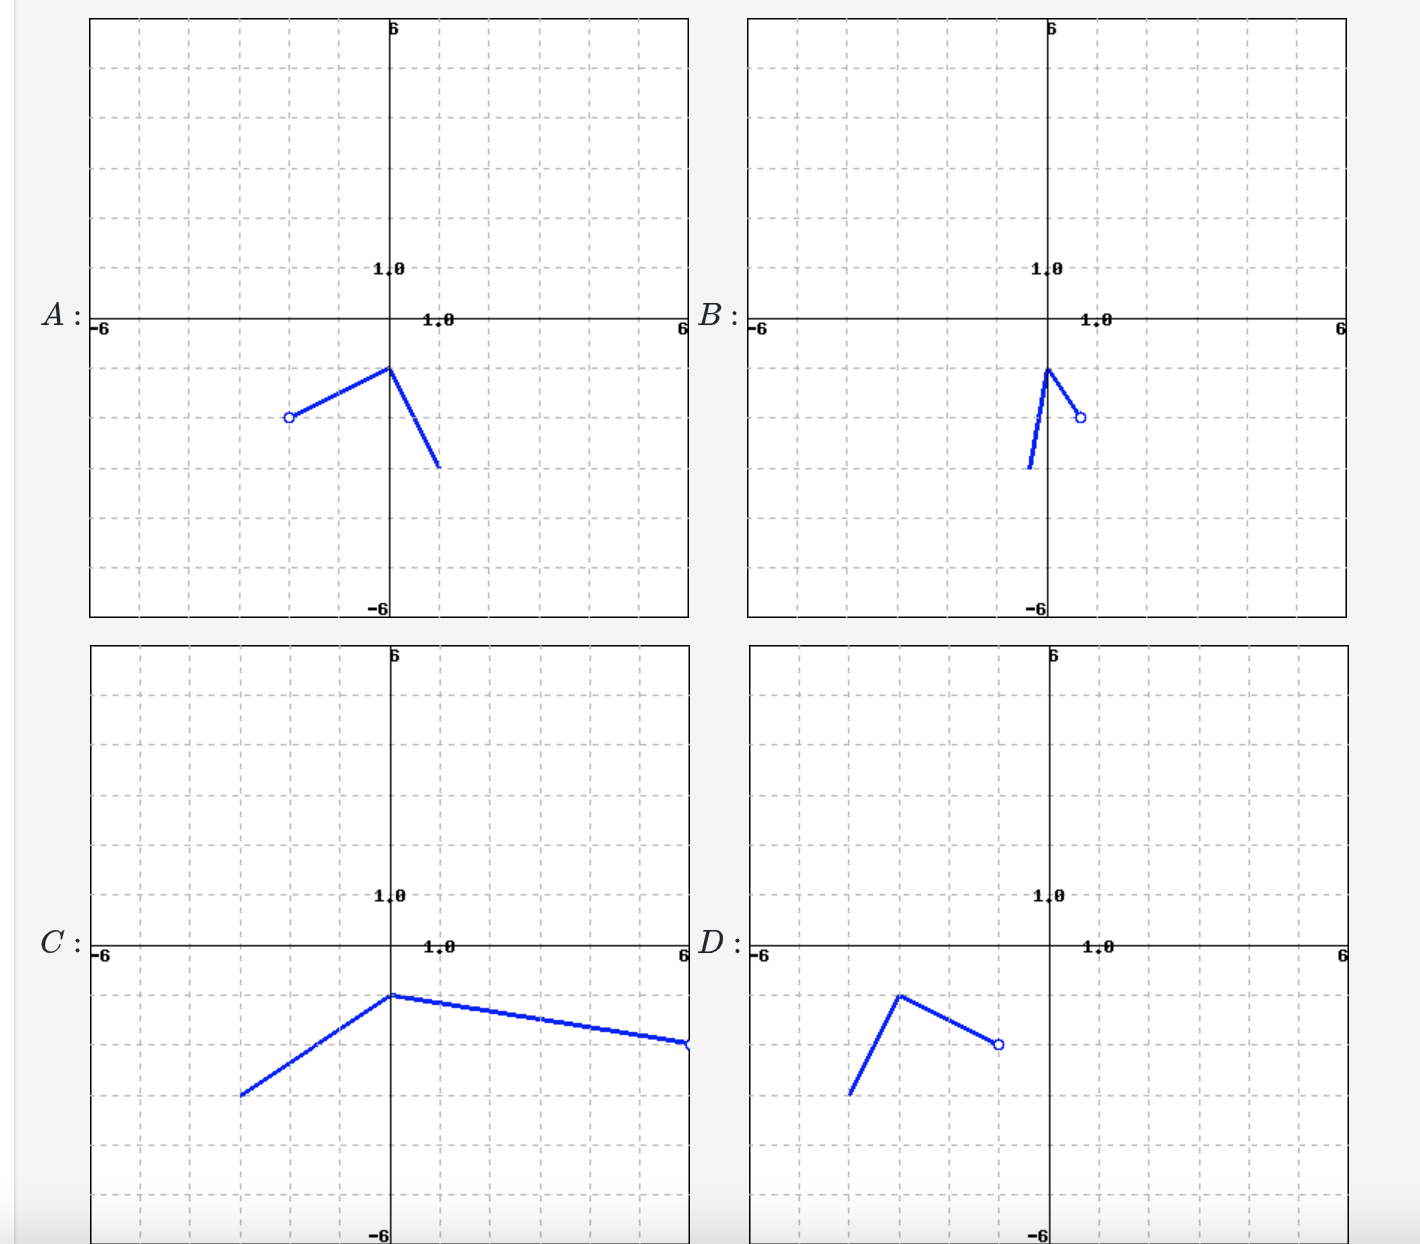
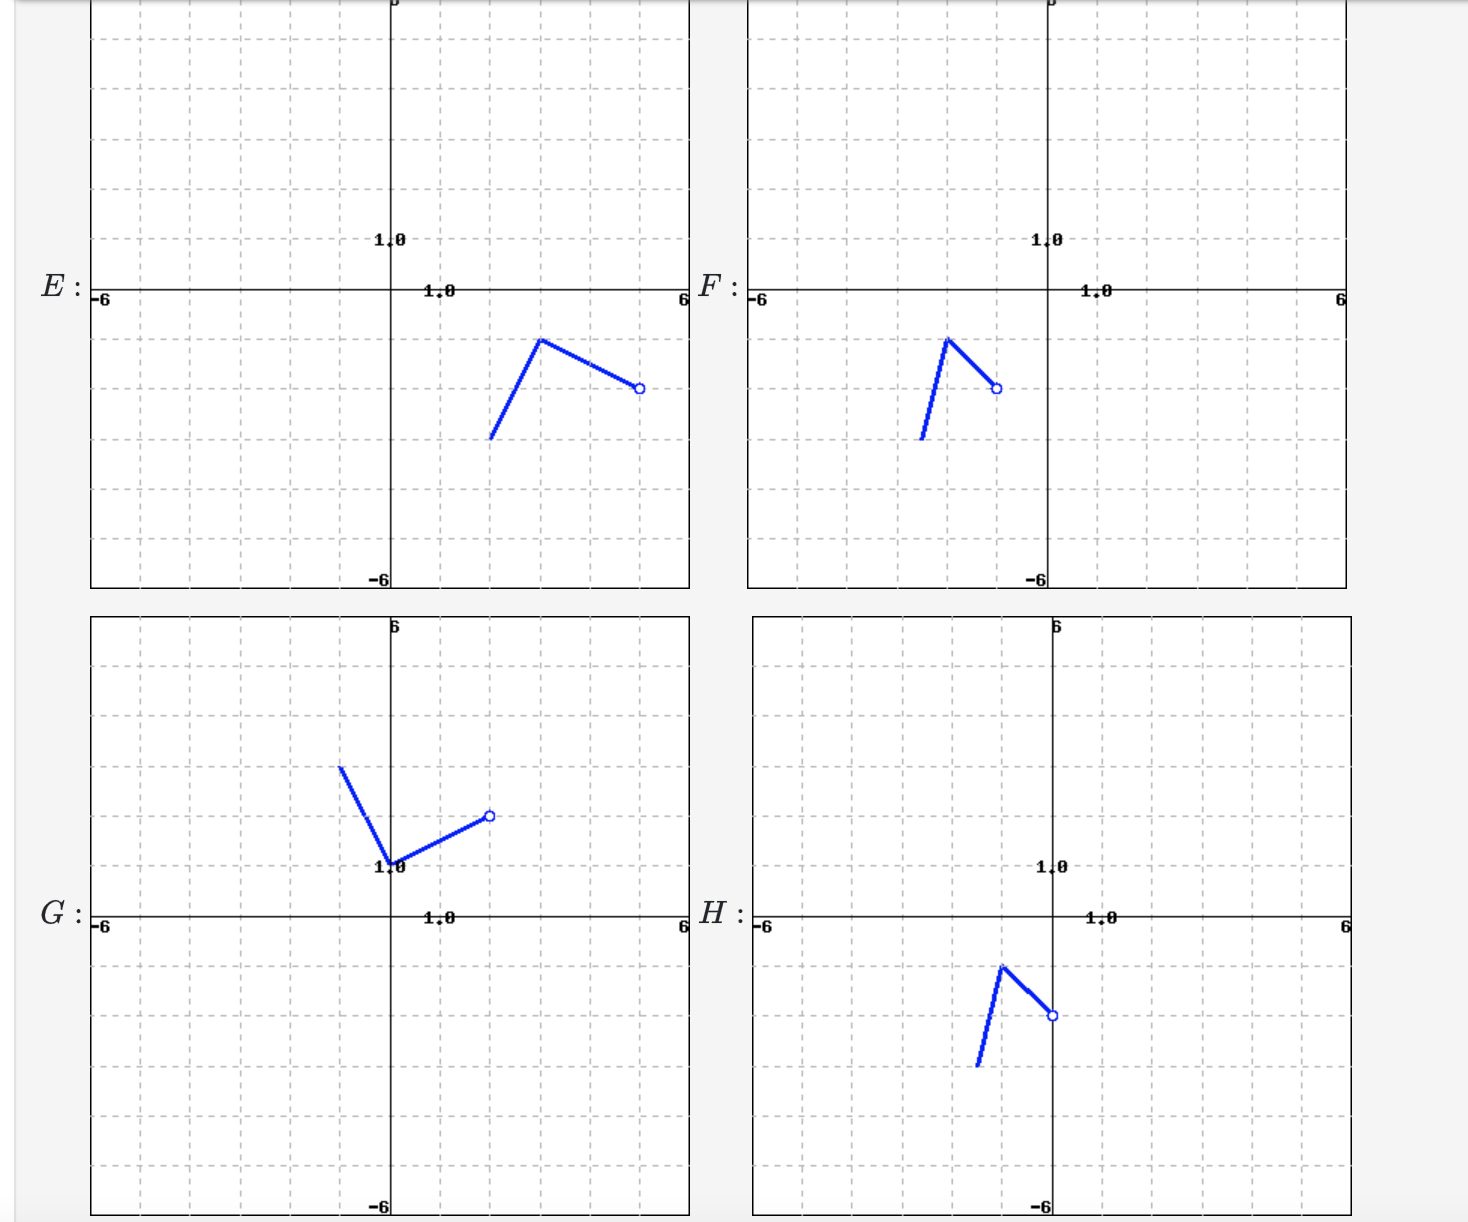
The graph of y = f(x) is illustrated below: -6 0 Identify which of the graphs...
Fantastic news! We've Found the answer you've been seeking!
Question:
Expert Answer:

Related Book For 
Posted Date:
