

Question: The graph shown below is an history graph from a measurement of Earthquake wave. The first part (called a P wave) travels at the
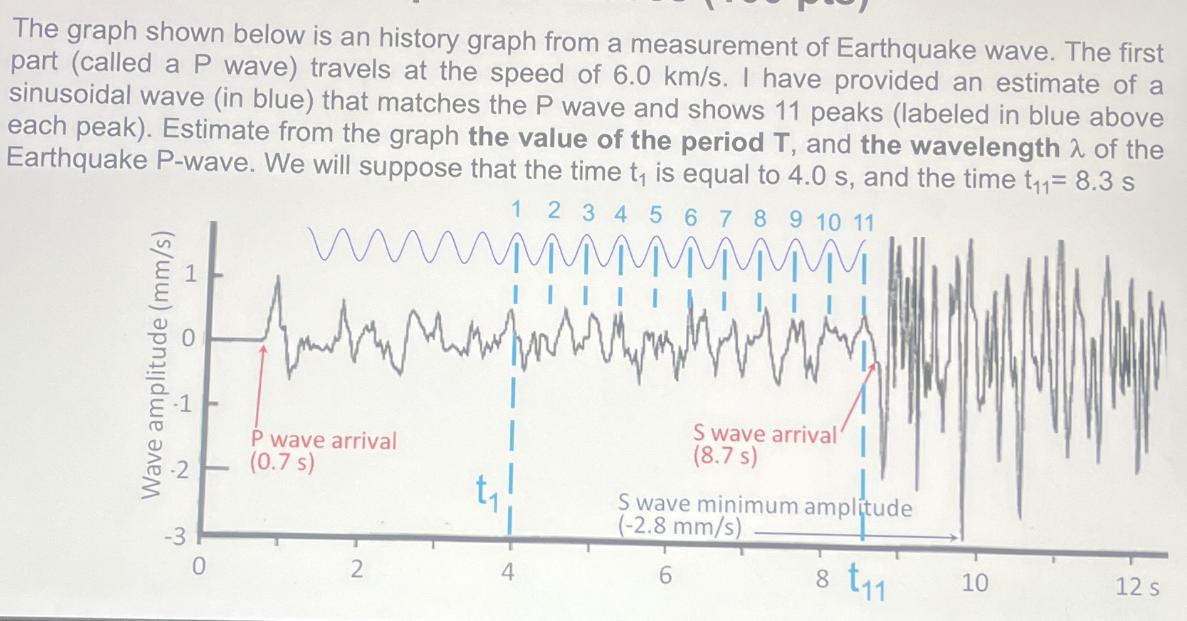
The graph shown below is an history graph from a measurement of Earthquake wave. The first part (called a P wave) travels at the speed of 6.0 km/s. I have provided an estimate of a sinusoidal wave (in blue) that matches the P wave and shows 11 peaks (labeled in blue above each peak). Estimate from the graph the value of the period T, and the wavelength of the Earthquake P-wave. We will suppose that the time t is equal to 4.0 s, and the time t = 8.3 s 1 2 3 4 5 6 7 8 9 10 11 P wave arrival (0.7 s) 0 2 t S wave arrival (8.7 s) S wave minimum amplitude (-2.8 mm/s) 6 8 11 10 12 s
Step by Step Solution
There are 3 Steps involved in it

Get step-by-step solutions from verified subject matter experts