

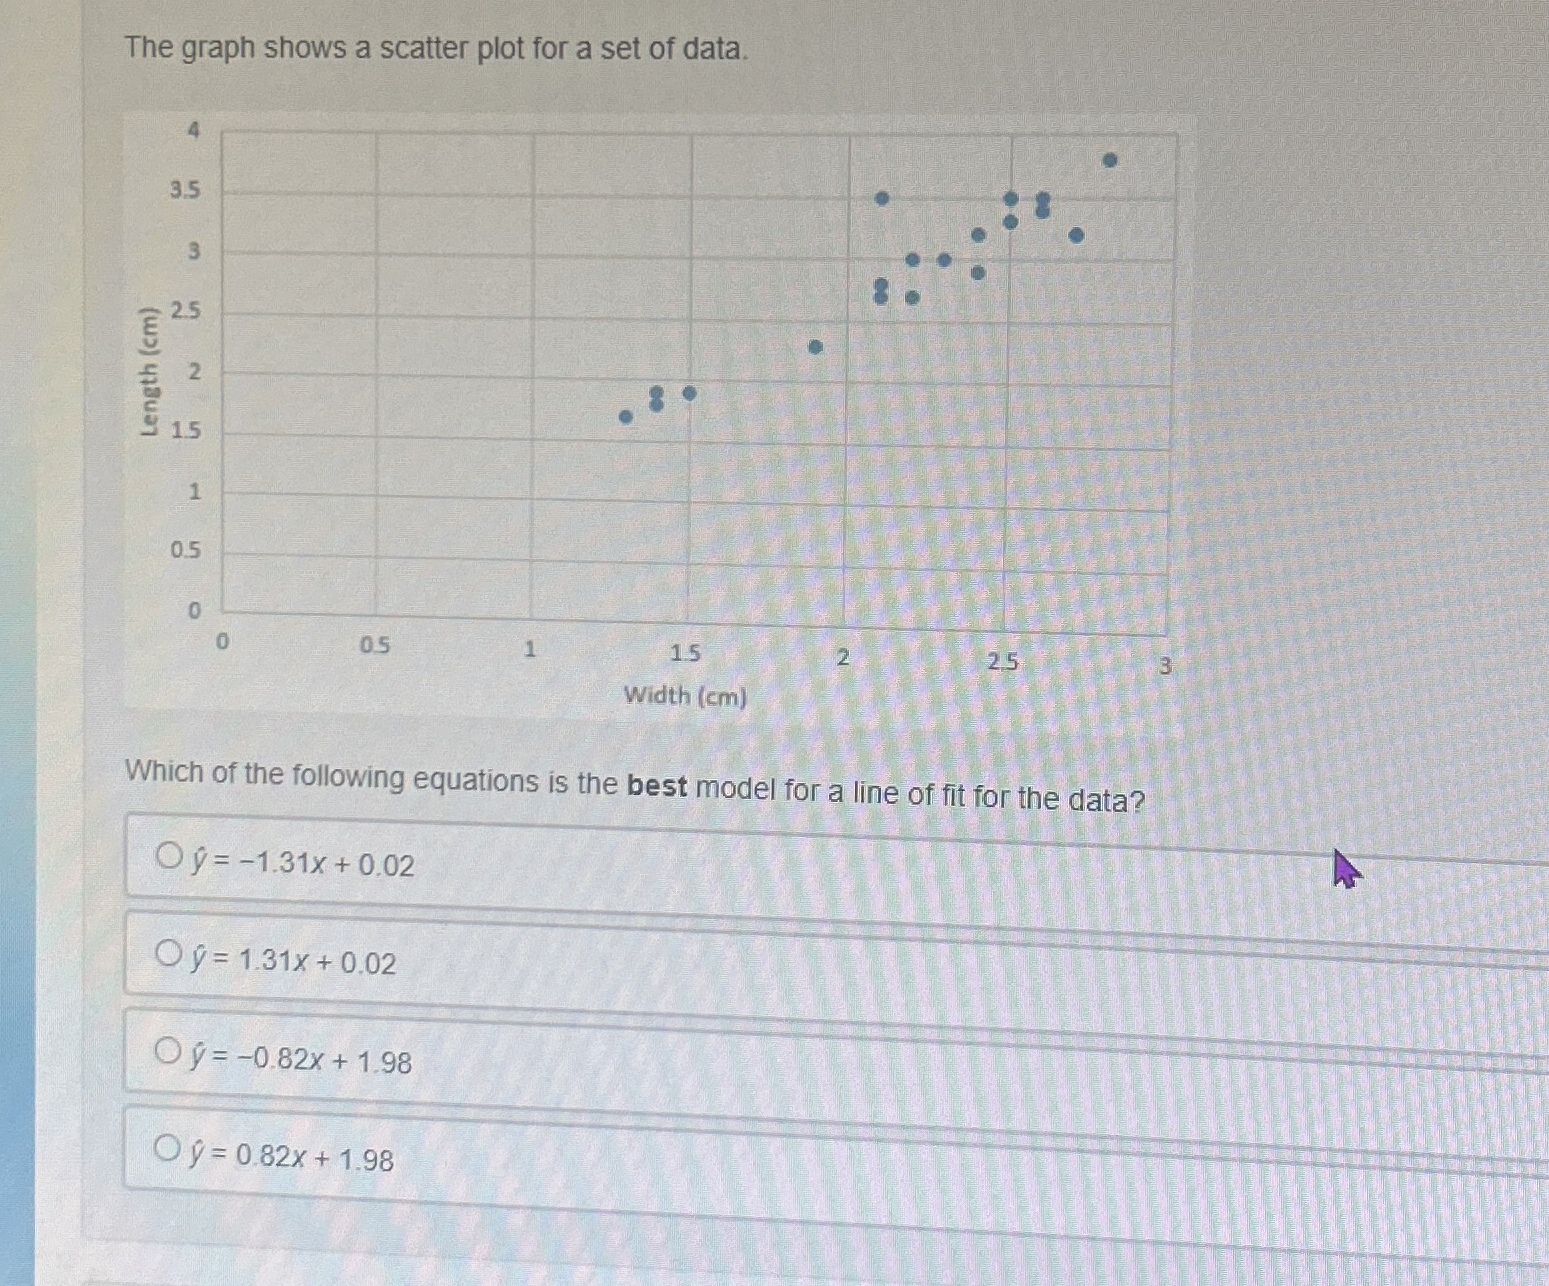
Question: The graph shows a scatter plot for a set of data. Which of the following equations is the best model for a line of fit
The graph shows a scatter plot for a set of data.
Which of the following equations is the best model for a line of fit for the data?
hat
hat
hat
Step by Step Solution
There are 3 Steps involved in it
1 Expert Approved Answer
Step: 1 Unlock

Question Has Been Solved by an Expert!
Get step-by-step solutions from verified subject matter experts
Step: 2 Unlock
Step: 3 Unlock