

Question: The graph shows how Daisy's utility changes as she consumes candy. Based on the preferences shown in the graph, arrange the pieces of candy from

The graph shows how Daisy's utility changes as she consumes candy. Based on the preferences shown in the graph, arrange the pieces of candy from highest marginal utility to lowest marginalutility.
We have to use the pieces of candy which are provided in the answer bank to arrange the level of marginal utility from the highest to the lowest.
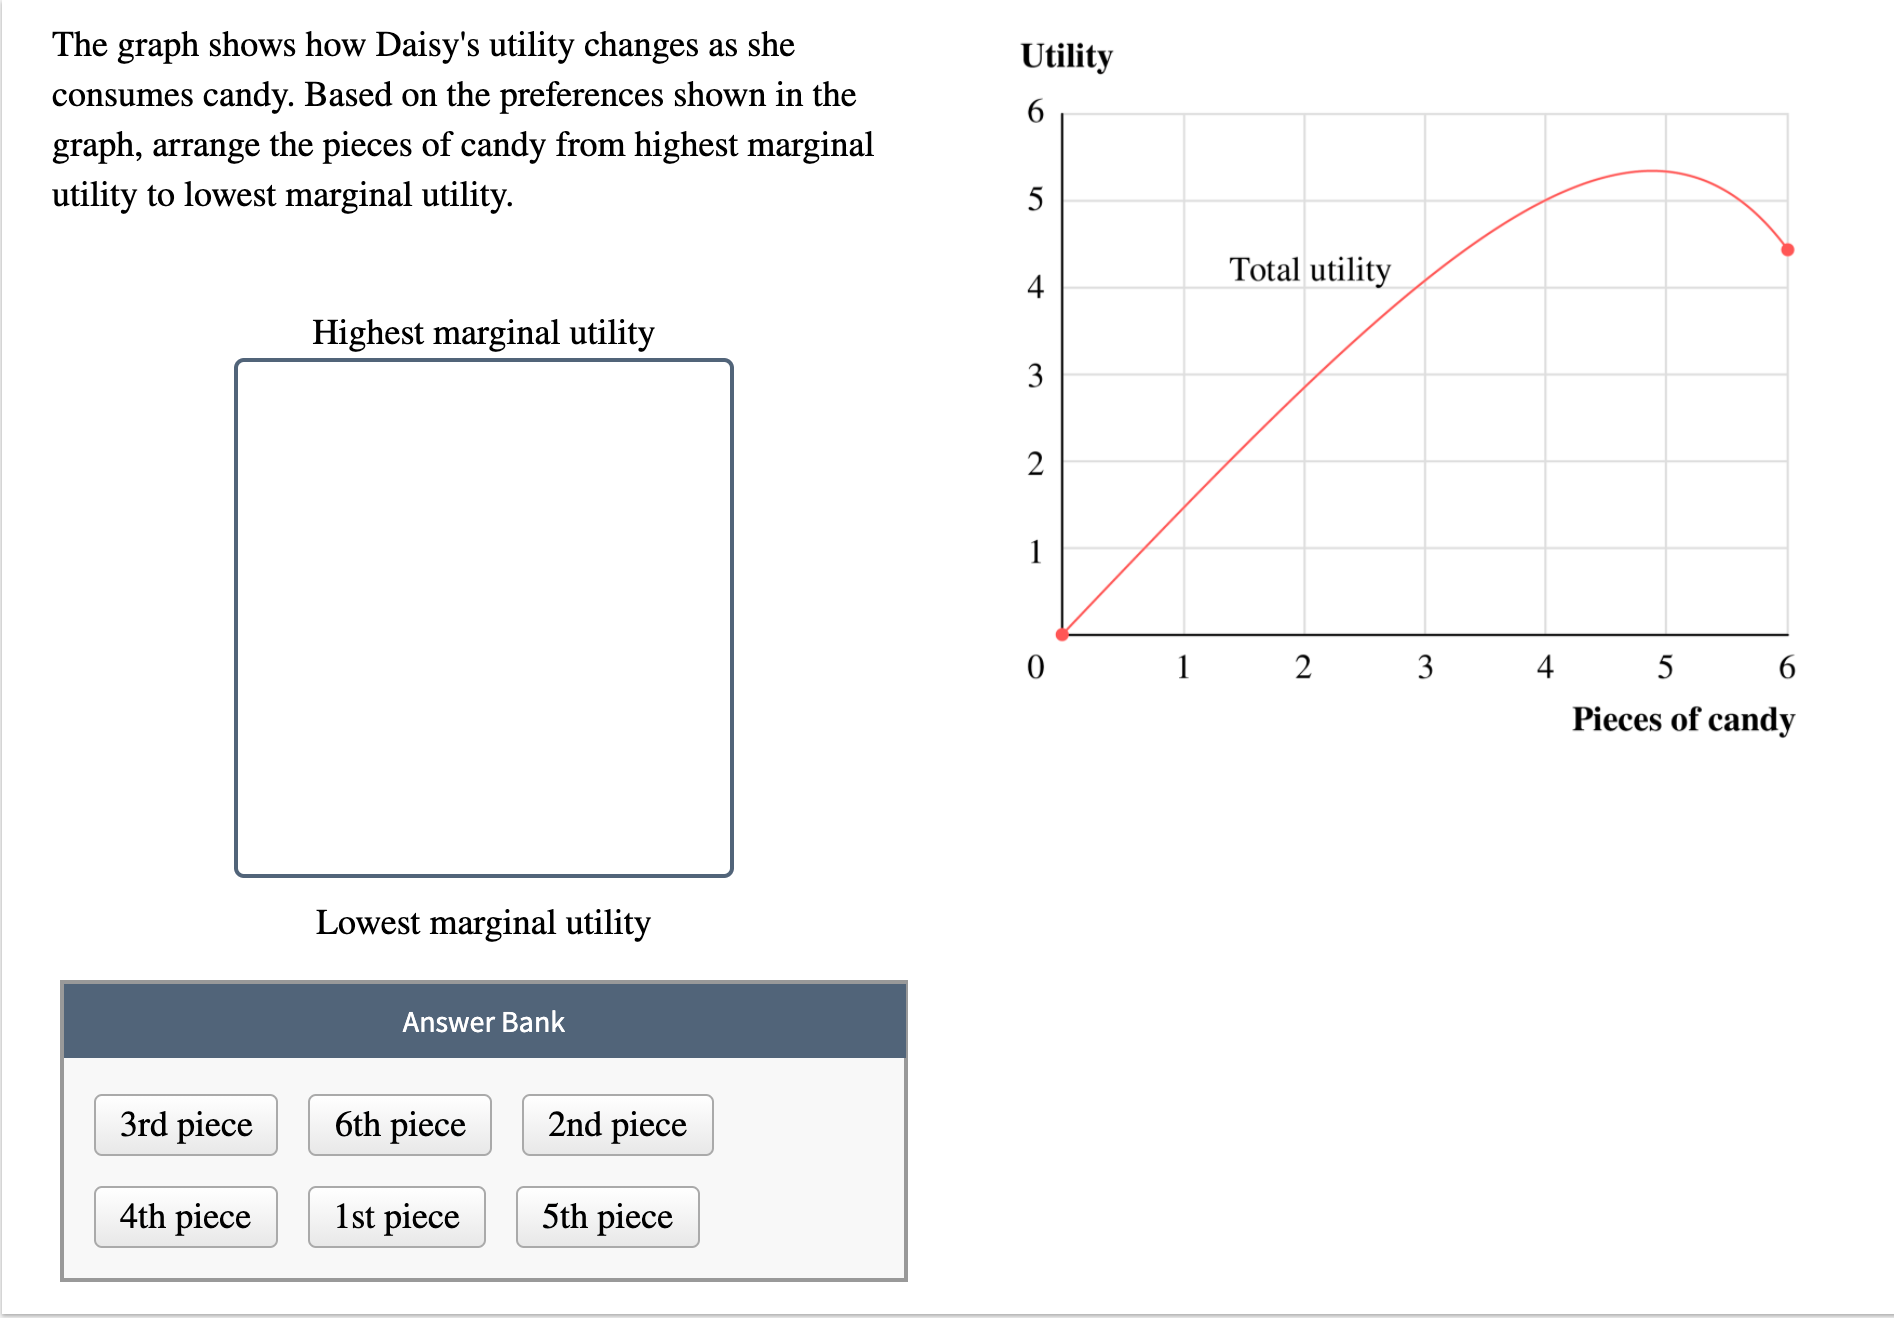
The graph shows how Daisy's utility changes as she Utility consumes candy. Based on the preferences shown in the 6 graph, arrange the pieces of candy from highest marginal utility to lowest marginal utility. 5 4 Total utility Highest marginal utility 3 2 1 0 l 2 3 4 5 6 Pieces of candy Lowest marginal utility Answer Bank I 3rd piece I I 6th piece I I 2nd piece I I 4th piece I I lst piece I I 5th piece
Step by Step Solution
There are 3 Steps involved in it

Get step-by-step solutions from verified subject matter experts