

Question: The graph shows the demand curve for computers and the supply curve of computers. Draw a point at the equilibrium price and quantity of computers.
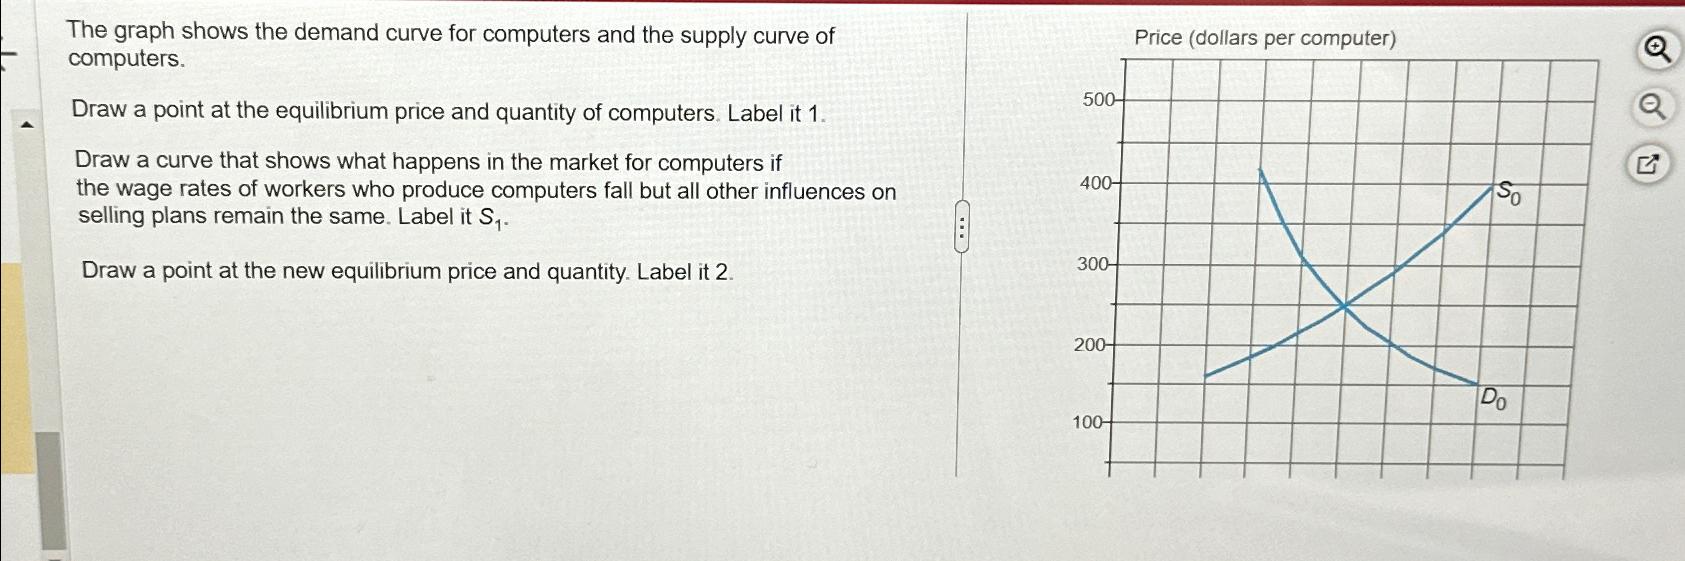
The graph shows the demand curve for computers and the supply curve of computers.
Draw a point at the equilibrium price and quantity of computers. Label it
Draw a curve that shows what happens in the market for computers if the wage rates of workers who produce computers fall but all other influences on selling plans remain the same. Label it
Draw a point at the new equilibrium price and quantity. Label it
Price dollars per computer
Step by Step Solution
There are 3 Steps involved in it
1 Expert Approved Answer
Step: 1 Unlock

Question Has Been Solved by an Expert!
Get step-by-step solutions from verified subject matter experts
Step: 2 Unlock
Step: 3 Unlock