

Question: The graphical method can be used to estimate the parameters of several viscosity models for polymer fluids, as demonstrated in Figure 5-7 of the textbook.
The graphical method can be used to estimate the parameters of several viscosity models for polymer fluids, as demonstrated in Figure 5-7 of the textbook. Apply the graphical method to estimate the 3 parameters of the Cross-Model, for fitting the experimental viscosity data shown in problem 5-2 of the textbook.
In addition, calculate the time constant for the polymer.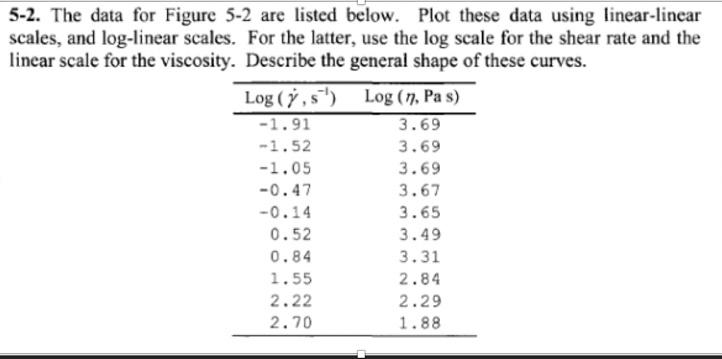
5-2. The data for Figure 5-2 are listed below. Plot these data using linear-linear scales, and log-linear scales. For the latter, use the log scale for the shear rate and the linear scale for the viscosity. Describe the general shape of these curves. Log (,s) Log (7, Pas) -1.91 3.69 -1.52 3.69 -1.05 3.69 -0.47 3.67 -0.14 3.65 0.52 3.49 0.84 3.31 1.55 2.84 2.22 2.29 2.70 1.88
Step by Step Solution
There are 3 Steps involved in it

Get step-by-step solutions from verified subject matter experts