

Question: The graphs below represent approximations of cost behavior patterns. The horizontal axis of each graph represents units and the vertical axis represents dollars of total
The graphs below represent approximations of cost behavior patterns. The horizontal axis of each graph represents units and the vertical axis represents dollars of total cost.
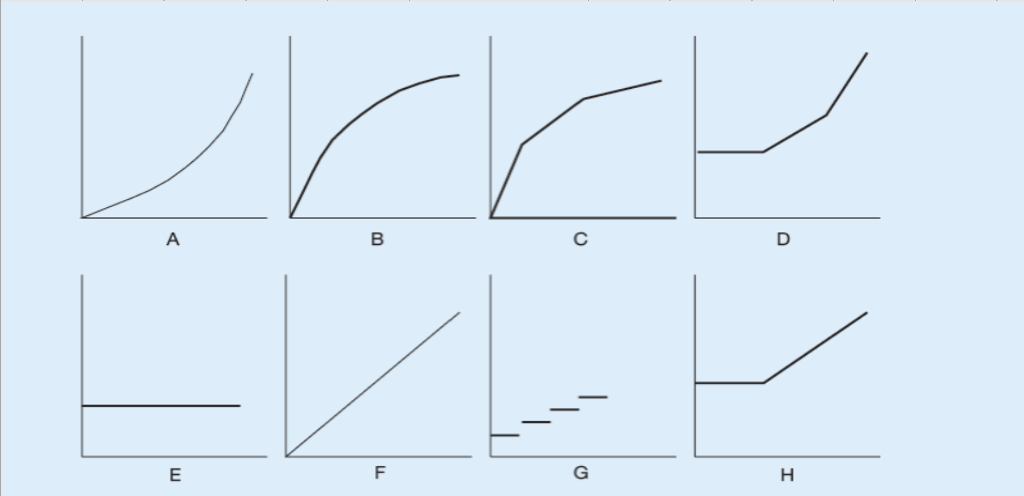
Select the graph that best matches each of the situations described below. Each graph may be selected more than once.
(Select the appropriate graph by using the drop-down answer box found at the end of each situation.)
A. Water bill that includes a flat fee for the first 10,000 gallons used plus an increasing usage charge for each additional 10,000 gallons used. AnswerABCDEFGH
f. Cost of factory supplies when increasing quantities bring cost discounts as each price break level is attained. AnswerABCDEFGH
B. Salaries of quality inspectors when one additional inspector is hired for each 20,000 units produced. AnswerABCDEFGH
C. Cost of an advertising campaign.AnswerABCDEFGH
Step by Step Solution
There are 3 Steps involved in it

Get step-by-step solutions from verified subject matter experts