

Question: The graphs below represent approximations of cost behavior patterns. The horizontal axis of each graph represents units and the vertical axis represents dollars of total
The graphs below represent approximations of cost behavior patterns. The horizontal axis of each graph represents units and the vertical axis represents dollars of total cost.
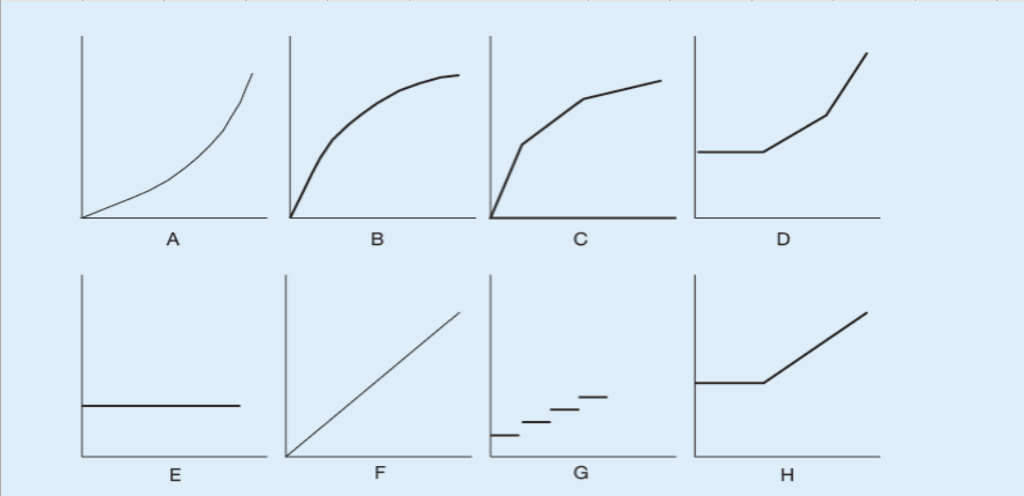
Select the graph that best matches each of the situations described below. Each graph may be selected more than once.
(Select the appropriate graph by using the drop-down answer box found at the end of each situation.)
a. Straight-line depreciation of a factory building. AnswerABCDEFGH
b. Utility bill for electricity that includes a fixed charge per month plus a constant usage rate per hour for hours in excess of 100 AnswerABCDEFGH
c. Cost of microchip incorporated into a product. AnswerABCDEFGH
d. Labor cost of machine operators who become more productive as they gain experience. AnswerABCDEFGH
Step by Step Solution
There are 3 Steps involved in it

Get step-by-step solutions from verified subject matter experts