

The histogram showing the distribution of times, in minutes, required for 25 rats in an animal behavior
Fantastic news! We've Found the answer you've been seeking!
Question:
The histogram showing the distribution of times, in minutes, required for 25 rats in an animal behavior experiment to navigate a maze successfully.
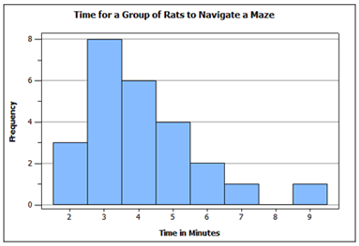
A possible value of the median in this example is:
- 3.3
- 3.9
- 4.6
- 5.5
It is impossible to answer without seeing all of the data.
Expert Answer:

Related Book For 
Fundamental Statistics for the Behavioral Sciences
ISBN: 978-1285076911
8th Edition
Authors: David C. Howell
Posted Date:
