

Question: The hold command is used when two (or more) plot commands must graph more than one function on the same figure. In this example you
- The hold command is used when two (or more) plot commands must graph more than one function on the same figure. In this example you will plot the functions y1 = 20x3 -200x2 + 400x + 3 and y2 = x3 -6x2 + 4x + 12 over the range 0 x 6.
- The plot for y1 must be in RED
- The plot for y2 must be in BLUE
- Generate appropriate axes labels and a title
- Turn on a grid pattern
- Generate a legend for the plot
The plot will resemble the one shown below: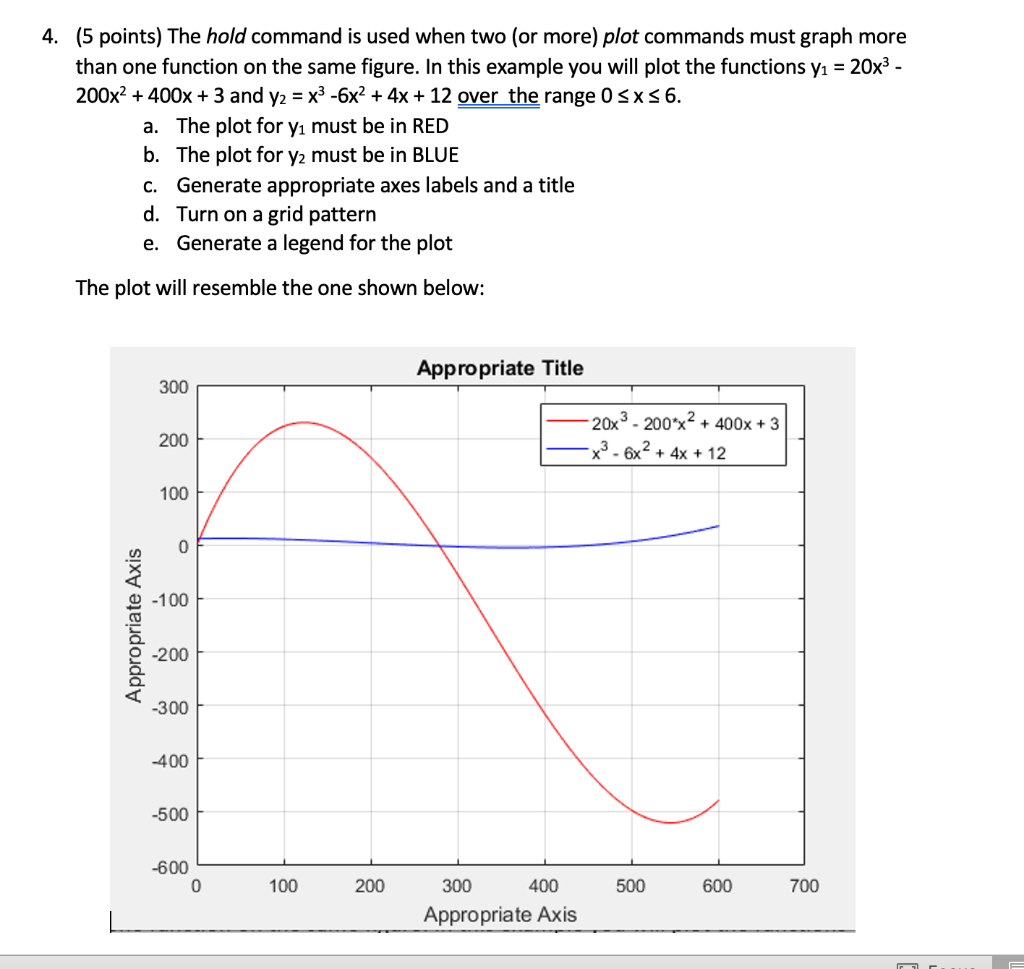
please help me with this MATLAB question
4. (5 points) The hold command is used when two (or more) plot commands must graph more than one function on the same figure. In this example you will plot the functions y1 = 20x3 - 200x2 + 400x + 3 and y2 = x3 -6x2 + 4x + 12 over the range 0 sx56. a. The plot for y must be in RED b. The plot for yz must be in BLUE C. Generate appropriate axes labels and a title d. Turn on a grid pattern e. Generate a legend for the plot The plot will resemble the one shown below: Appropriate Title 300 200 20x3 - 200*x2 + 400x + 3 -x3-6x2 + 4x + 12 100 0 -100 Appropriate Axis -200 -300 400 -500 -600 0 100 200 500 600 700 300 400 Appropriate Axis
Step by Step Solution
There are 3 Steps involved in it

Get step-by-step solutions from verified subject matter experts