

Question: The horizontal axis is labeled quantity. The quantities marked on the horizontal axis from left to right are as follows: Q 3, Q 2, and
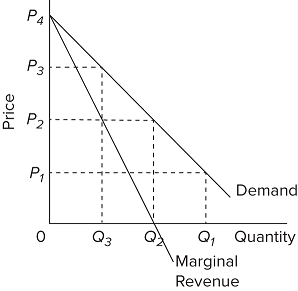
The horizontal axis is labeled quantity. The quantities marked on the horizontal axis from left to right are as follows: Q 3, Q 2, and Q 1. The vertical axis is labeled price. The prices marked on the vertical axis from bottom to top are as follows: P 1, P 2, P 3, and P 4. The graph shows 2 falling lines labeled demand and marginal revenue. The falling line labeled demand begins at (0, P 4), passes through (Q 3, P 3), (Q 2, P 2), and (Q 1, P 1), and ends at the bottom right. The falling line labeled marginal revenue begins at (0, P 4), passes through (Q 3, P 2) and (Q 2, 0), and ends at a point that is slightly below the horizontal axis.
Refer to the diagram. If this somehow was a costless product (that is, the total cost of any level of output was zero), the firm would maximize profits by
A. selling the product at the highest possible price at which a positive quantity will be demanded.
B. producing Q3 units and charging a price of P3.
C. producing Q1 units and charging a price of P1.
D. producing Q2 units and charging a price of P2.
Price P4 P3 P P 0 Q3 Demand Q Quantity Marginal Revenue
Step by Step Solution
There are 3 Steps involved in it
Based on the information given The product has zero marginal cost of production ... View full answer

Get step-by-step solutions from verified subject matter experts