

Question: The horizontal axis is labeled quantity. The quantities marked on the horizontal axis from left to right are as follows: Q 3, Q 2, and
The horizontal axis is labeled quantity. The quantities marked on the horizontal axis from left to right are as follows: Q 3, Q 2, and Q 1. The vertical axis is labeled price. The prices marked on the vertical axis from bottom to top are as follows: P 1, P 2, P 3, and P 4. The graph shows 2 falling lines labeled demand and marginal revenue. The falling line labeled demand begins at (0, P 4), passes through (Q 3, P 3), (Q 2, P 2), and (Q 1, P 1), and ends at the bottom right. The falling line labeled marginal revenue begins at (0, P 4), passes through (Q 3, P 2) and (Q 2, 0), and ends at a point that is slightly below the horizontal axis.
In the accompanying diagram, demand is relatively elastic
A. only at price P2.
B. in the 0P1 price range.
C, in the P2P4 price range.
D. in the P2P1 price range.
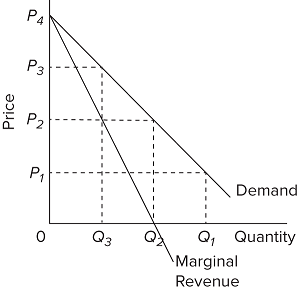
Price P4 P3 P P 0 Q3 Demand Q Quantity Marginal Revenue
Step by Step Solution
3.34 Rating (151 Votes )
There are 3 Steps involved in it
ANSWER Based on the information provided in the diagram the demand is relatively elastic in the P2P4 ... View full answer

Get step-by-step solutions from verified subject matter experts