

Question: The horizontal axis is labeled quantity. The vertical axis is labeled price. A rising curve labeled S and a falling curve labeled D are plotted.
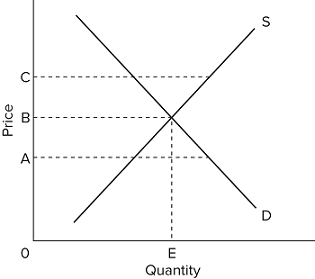 The horizontal axis is labeled quantity. The vertical axis is labeled price. A rising curve labeled S and a falling curve labeled D are plotted. The point of intersection of the S and D curves corresponds to quantity E and price B. A point is shown on the S curve corresponding to price C which is higher than B. A point is shown on the D curve corresponding to price A which is less than B.
Refer to the diagram. An effective government-set price floor is best illustrated by
Price CO A 0 E Quantity S D
Step by Step Solution
There are 3 Steps involved in it
The detailed answer for the above question is provided below Answer ANSWER OPTION A EXPLANATION Acco... View full answer

Get step-by-step solutions from verified subject matter experts