

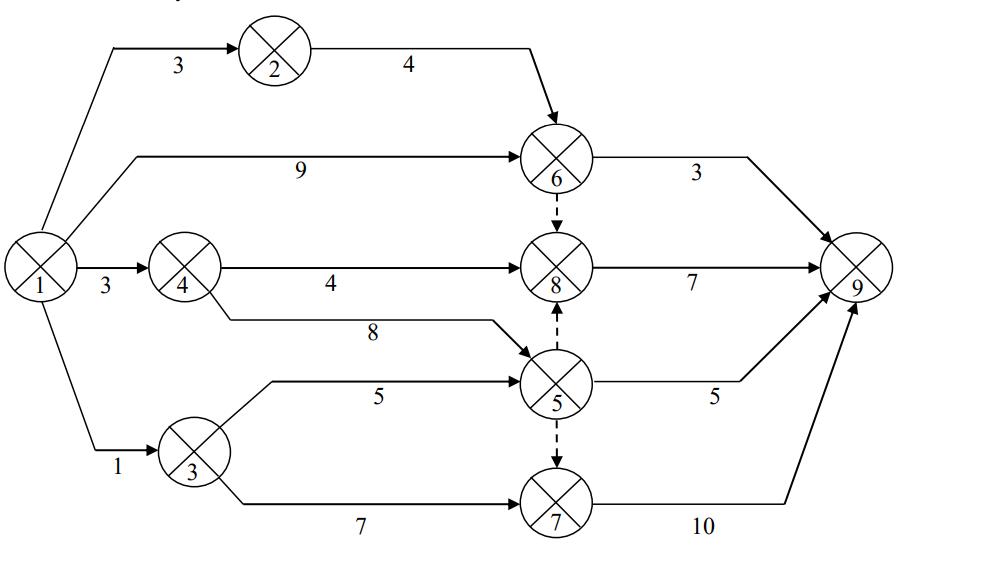
Question: The network for a project is shown below. Activity times, in days, are indicated by the figure that appears under each activity. The number of
The network for a project is shown below. Activity times, in days, are indicated by the figure that appears under each activity.
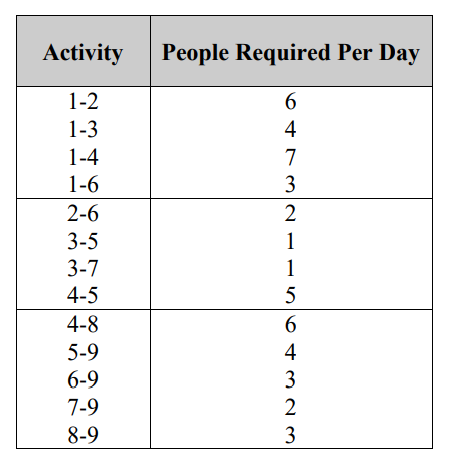
The number of people required for each activity is shown in the following table. The duration of individual activities cannot be altered by the allocation of additional people, nor may activities be divided into smaller components performed at different times.
1) Neatly sketch a sequenced bar chart, not a Gantt chart, for the above project with all activities shown at their earliest start times.
2) Indicate the number of people required on each day of the project with all activities at their earliest start times.
3) By utilizing the floats in the various activities, smooth the daily requirement for people as much as possible. What is the minimum ceiling of people required to complete the project in minimum time? Justify your answer by redrawing the bar chart and indicating the people required on each day.
\begin{tabular}{|c|c|} \hline Activity & People Required Per Day \\ \hline 12 & 6 \\ 13 & 4 \\ 14 & 7 \\ 16 & 3 \\ \hline 26 & 2 \\ 35 & 1 \\ 37 & 1 \\ 45 & 5 \\ \hline 48 & 6 \\ 59 & 4 \\ 69 & 3 \\ 79 & 2 \\ 89 & 3 \\ \hline \end{tabular}
Step by Step Solution
There are 3 Steps involved in it

Get step-by-step solutions from verified subject matter experts