

Question: A network for a project is shown below. Activity times, in days, are indicated by the figure that appears under the activity. (i) Analysis the
A network for a project is shown below. Activity times, in days, are indicated by the figure that appears under the activity.
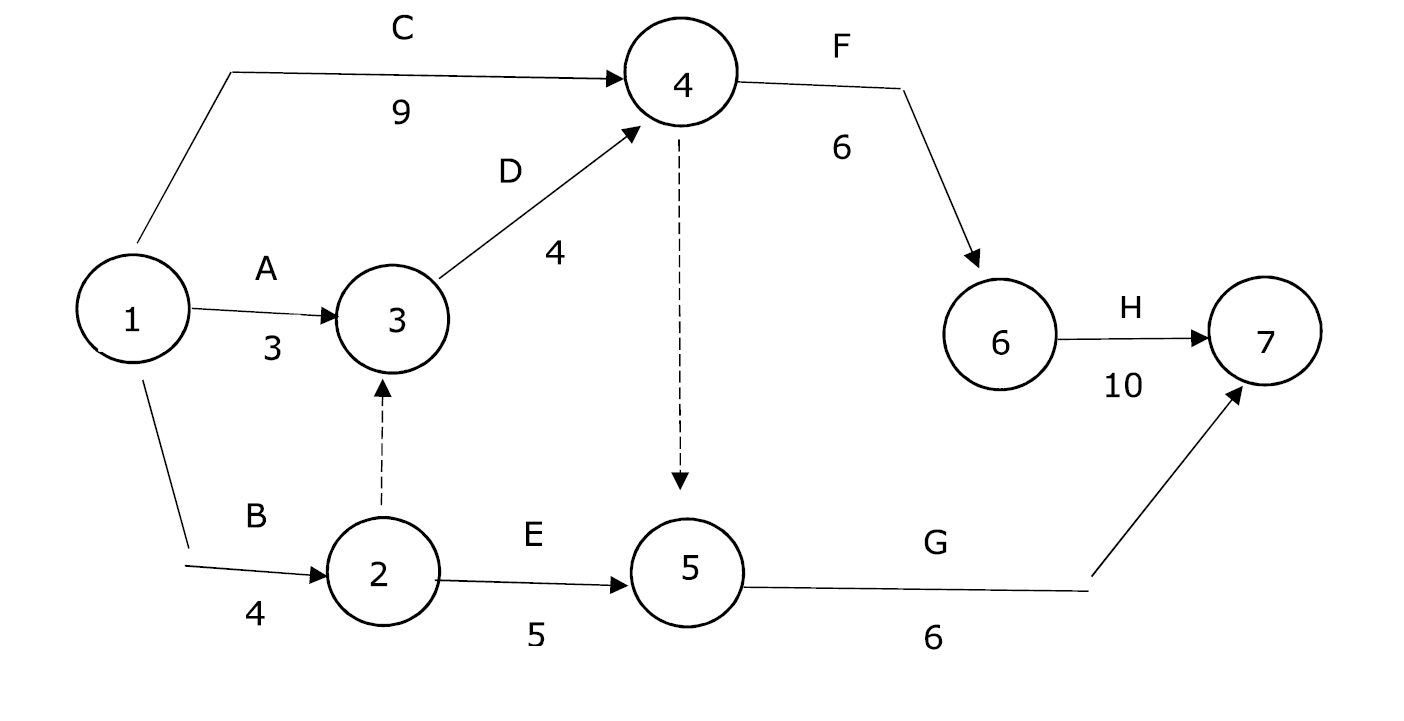
(i) Analysis the network, determine the critical path and calculate the earliest start, earliest finish, latest start, latest finish and total float, free float and independent float for each activity
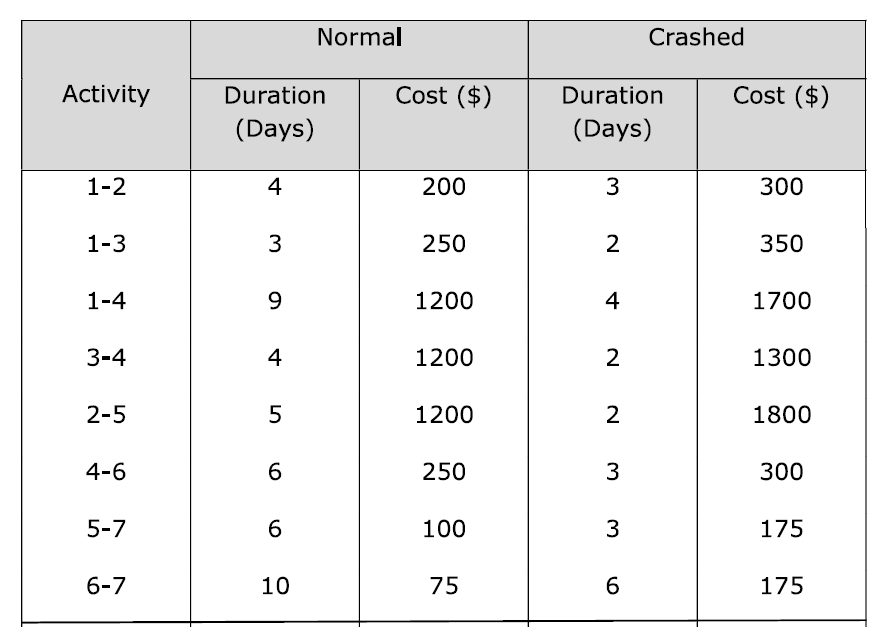
(ii) For the network above, the normal and crashed durations for the activities in the project, together with their associated costs, are shown in the table below. Determine cost increase per day for each activity.
 (iii) Assuming that the only way of reducing the project time is by increasing the costs, indicate which activity or activities should be crashed to reduce the project time and associated costs to minimum total cost given that indirect costs are $100 per day. What is the project duration and minimum cost? (iv) What is the minimum possible project duration? What is total cost at this point also with indirect costs of $100 per day?
\begin{tabular}{|c|c|c|c|c|} \hline \multirow{2}{*}{ Activity } & \multicolumn{2}{|c|}{ Normal } & \multicolumn{2}{c|}{ Crashed } \\ \cline { 2 - 5 } & Duration (Days) & Cost (\$) & Duration (Days) & Cost (\$) \\ \hline 12 & 4 & 200 & 3 & 300 \\ 13 & 3 & 250 & 2 & 350 \\ 14 & 9 & 1200 & 4 & 1700 \\ 34 & 4 & 1200 & 2 & 1300 \\ 25 & 5 & 1200 & 2 & 1800 \\ 46 & 6 & 250 & 3 & 300 \\ 57 & 6 & 100 & 3 & 175 \\ 67 & 10 & 75 & 6 & 175 \\ \hline \end{tabular}
Step by Step Solution
There are 3 Steps involved in it

Get step-by-step solutions from verified subject matter experts