

Question: The network for a project is shown below. Activity times, in days, are indicated by the figure that appears under each activity. (i) Analyse the
The network for a project is shown below. Activity times, in days, are indicated by the figure that appears under each activity.
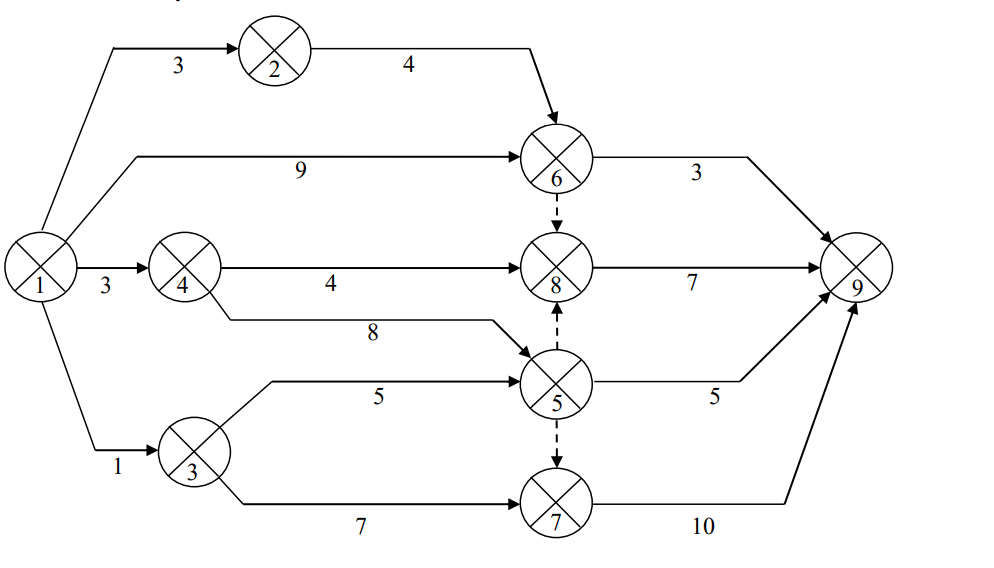 (i) Analyse the network to determine the earliest and latest event times and the minimum project duration. Indicate the critical path for the project.
(ii) What amount of free float is associated with activity 2-6?
Step by Step Solution
There are 3 Steps involved in it
1 Expert Approved Answer
Step: 1 Unlock

Question Has Been Solved by an Expert!
Get step-by-step solutions from verified subject matter experts
Step: 2 Unlock
Step: 3 Unlock