

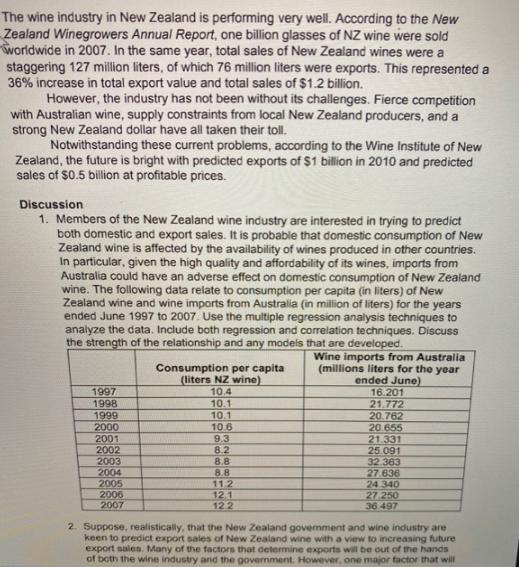
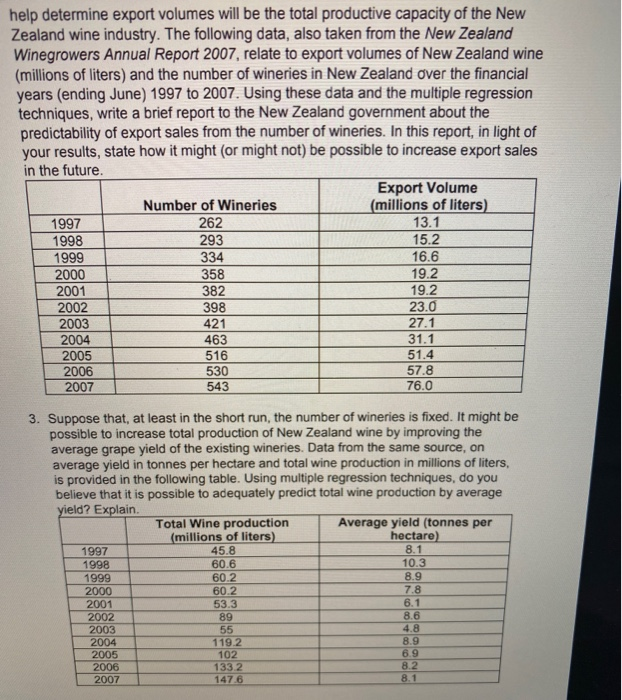
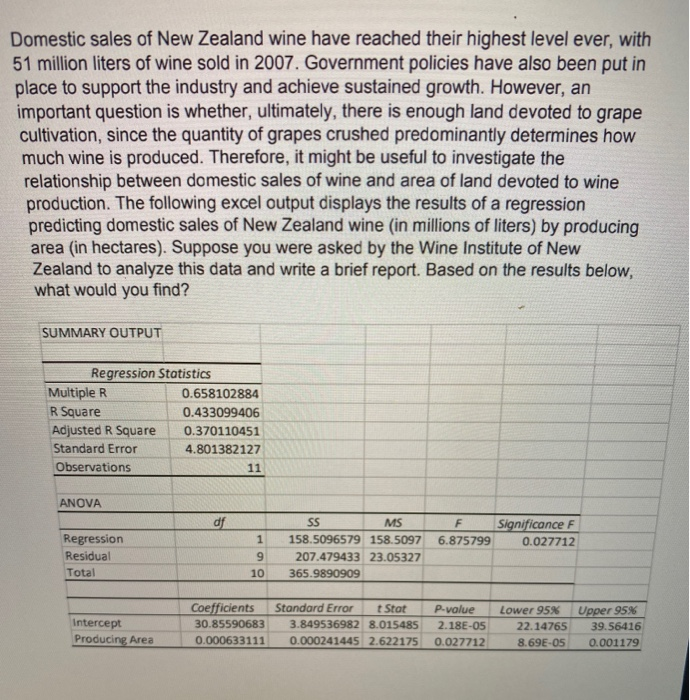
The wine industry in New Zealand is performing very well. According to the New Zealand Winegrowers...
Fantastic news! We've Found the answer you've been seeking!
Question:
Transcribed Image Text:
The wine industry in New Zealand is performing very well. According to the New Zealand Winegrowers Annual Report, one billion glasses of NZ wine were sold worldwide in 2007. In the same year, total sales of New Zealand wines were a staggering 127 million liters, of which 76 million liters were exports. This represented a 36% increase in total export value and total sales of $1.2 billion. However, the industry has not been without its challenges. Fierce competition with Australian wine, supply constraints from local New Zealand producers, and a strong New Zealand dollar have all taken their toll. Notwithstanding these current problems, according to the Wine Institute of New Zealand, the future is bright with predicted exports of $1 billion in 2010 and predicted sales of $0.5 billion at profitable prices. Discussion 1. Members of the New Zealand wine industry are interested in trying to predict both domestic and export sales. It is probable that domestic consumption of New Zealand wine is affected by the availability of wines produced in other countries. In particular, given the high quality and affordability of its wines, imports from Australia could have an adverse effect on domestic consumption of New Zealand wine. The following data relate to consumption per capita (in liters) of New Zealand wine and wine imports from Australia (in million of liters) for the years ended June 1997 to 2007. Use the multiple regression analysis techniques to analyze the data. Include both regression and correlation techniques. Discuss the strength of the relationship and any models that are developed. 1997 1998 1999 2000 2001 2002 2003 2004 2005 2006 2007 Consumption per capita (liters NZ wine) 10.4 10.1 10.1 10.6 9.3 8.2 8.8 8.8 11.2 12.1 12.2 Wine imports from Australia (millions liters for the year ended June) 16.201 21.772 20.762 20.655 21.331 25.091 32.363 27.636 24.340 27.250 36.497 2. Suppose, realistically, that the New Zealand government and wine industry are keen to predict export sales of New Zealand wine with a view to increasing future export sales. Many of the factors that determine exports will be out of the hands of both the wine industry and the government. However, one major factor that will help determine export volumes will be the total productive capacity of the New Zealand wine industry. The following data, also taken from the New Zealand Winegrowers Annual Report 2007, relate to export volumes of New Zealand wine (millions of liters) and the number of wineries in New Zealand over the financial years (ending June) 1997 to 2007. Using these data and the multiple regression techniques, write a brief report to the New Zealand government about the predictability of export sales from the number of wineries. In this report, in light of your results, state how it might (or might not) be possible to increase export sales in the future. 1997 1998 1999 2000 2001 2002 2003 2004 2005 2006 2007 Number of Wineries 262 293 1997 1998 1999 2000 2001 2002 2003 2004 2005 2006 2007 334 358 382 398 421 463 516 530 543 Total Wine production (millions of liters) 45.8 60.6 60.2 Export Volume (millions of liters) 3. Suppose that, at least in the short run, the number of wineries is fixed. It might be possible to increase total production of New Zealand wine by improving the average grape yield of the existing wineries. Data from the same source, on average yield in tonnes per hectare and total wine production in millions of liters, is provided in the following table. Using multiple regression techniques, do you believe that it is possible to adequately predict total wine production by average yield? Explain. 60.2 53.3 89 55 119.2 102 133.2 147.6 13.1 15.2 16.6 19.2 19.2 23.0 27.1 31.1 51.4 57.8 76.0 Average yield (tonnes per hectare) 8.1 10.3 8.9 7.8 6.1 8.6 4.8 8.9 6.9 8.2 8.1 Domestic sales of New Zealand wine have reached their highest level ever, with 51 million liters of wine sold in 2007. Government policies have also been put in place to support the industry and achieve sustained growth. However, an important question is whether, ultimately, there is enough land devoted to grape cultivation, since the quantity of grapes crushed predominantly determines how much wine is produced. Therefore, it might be useful to investigate the relationship between domestic sales of wine and area of land devoted to wine production. The following excel output displays the results of a regression predicting domestic sales of New Zealand wine (in millions of liters) by producing area (in hectares). Suppose you were asked by the Wine Institute of New Zealand to analyze this data and write a brief report. Based on the results below, what would you find? SUMMARY OUTPUT Regression Statistics Multiple R R Square Adjusted R Square Standard Error Observations ANOVA Regression Residual Total Intercept Producing Area 0.658102884 0.433099406 0.370110451 4.801382127 df 11 1 9 10 SS MS F 158.5096579 158.5097 6.875799 207.479433 23.05327 365.9890909 Coefficients Standard Error t Stat P-value 30.85590683 3.849536982 8.015485 2.18E-05 0.000633111 0.000241445 2.622175 0.027712 Significance F 0.027712 Lower 95% Upper 95% 22.14765 39.56416 8.69E-05 0.001179 The wine industry in New Zealand is performing very well. According to the New Zealand Winegrowers Annual Report, one billion glasses of NZ wine were sold worldwide in 2007. In the same year, total sales of New Zealand wines were a staggering 127 million liters, of which 76 million liters were exports. This represented a 36% increase in total export value and total sales of $1.2 billion. However, the industry has not been without its challenges. Fierce competition with Australian wine, supply constraints from local New Zealand producers, and a strong New Zealand dollar have all taken their toll. Notwithstanding these current problems, according to the Wine Institute of New Zealand, the future is bright with predicted exports of $1 billion in 2010 and predicted sales of $0.5 billion at profitable prices. Discussion 1. Members of the New Zealand wine industry are interested in trying to predict both domestic and export sales. It is probable that domestic consumption of New Zealand wine is affected by the availability of wines produced in other countries. In particular, given the high quality and affordability of its wines, imports from Australia could have an adverse effect on domestic consumption of New Zealand wine. The following data relate to consumption per capita (in liters) of New Zealand wine and wine imports from Australia (in million of liters) for the years ended June 1997 to 2007. Use the multiple regression analysis techniques to analyze the data. Include both regression and correlation techniques. Discuss the strength of the relationship and any models that are developed. 1997 1998 1999 2000 2001 2002 2003 2004 2005 2006 2007 Consumption per capita (liters NZ wine) 10.4 10.1 10.1 10.6 9.3 8.2 8.8 8.8 11.2 12.1 12.2 Wine imports from Australia (millions liters for the year ended June) 16.201 21.772 20.762 20.655 21.331 25.091 32.363 27.636 24.340 27.250 36.497 2. Suppose, realistically, that the New Zealand government and wine industry are keen to predict export sales of New Zealand wine with a view to increasing future export sales. Many of the factors that determine exports will be out of the hands of both the wine industry and the government. However, one major factor that will help determine export volumes will be the total productive capacity of the New Zealand wine industry. The following data, also taken from the New Zealand Winegrowers Annual Report 2007, relate to export volumes of New Zealand wine (millions of liters) and the number of wineries in New Zealand over the financial years (ending June) 1997 to 2007. Using these data and the multiple regression techniques, write a brief report to the New Zealand government about the predictability of export sales from the number of wineries. In this report, in light of your results, state how it might (or might not) be possible to increase export sales in the future. 1997 1998 1999 2000 2001 2002 2003 2004 2005 2006 2007 Number of Wineries 262 293 1997 1998 1999 2000 2001 2002 2003 2004 2005 2006 2007 334 358 382 398 421 463 516 530 543 Total Wine production (millions of liters) 45.8 60.6 60.2 Export Volume (millions of liters) 3. Suppose that, at least in the short run, the number of wineries is fixed. It might be possible to increase total production of New Zealand wine by improving the average grape yield of the existing wineries. Data from the same source, on average yield in tonnes per hectare and total wine production in millions of liters, is provided in the following table. Using multiple regression techniques, do you believe that it is possible to adequately predict total wine production by average yield? Explain. 60.2 53.3 89 55 119.2 102 133.2 147.6 13.1 15.2 16.6 19.2 19.2 23.0 27.1 31.1 51.4 57.8 76.0 Average yield (tonnes per hectare) 8.1 10.3 8.9 7.8 6.1 8.6 4.8 8.9 6.9 8.2 8.1 Domestic sales of New Zealand wine have reached their highest level ever, with 51 million liters of wine sold in 2007. Government policies have also been put in place to support the industry and achieve sustained growth. However, an important question is whether, ultimately, there is enough land devoted to grape cultivation, since the quantity of grapes crushed predominantly determines how much wine is produced. Therefore, it might be useful to investigate the relationship between domestic sales of wine and area of land devoted to wine production. The following excel output displays the results of a regression predicting domestic sales of New Zealand wine (in millions of liters) by producing area (in hectares). Suppose you were asked by the Wine Institute of New Zealand to analyze this data and write a brief report. Based on the results below, what would you find? SUMMARY OUTPUT Regression Statistics Multiple R R Square Adjusted R Square Standard Error Observations ANOVA Regression Residual Total Intercept Producing Area 0.658102884 0.433099406 0.370110451 4.801382127 df 11 1 9 10 SS MS F 158.5096579 158.5097 6.875799 207.479433 23.05327 365.9890909 Coefficients Standard Error t Stat P-value 30.85590683 3.849536982 8.015485 2.18E-05 0.000633111 0.000241445 2.622175 0.027712 Significance F 0.027712 Lower 95% Upper 95% 22.14765 39.56416 8.69E-05 0.001179
Expert Answer:
Answer rating: 100% (QA)
Let the Consumption per capita be X and Wine imports from Australia be Y Then the correlation betwee... View the full answer

Related Book For 

International Business
ISBN: 9781292274157
8th Edition
Authors: Simon Collinson, Rajneesh Narula, Alan M. Rugman
Posted Date:
Students also viewed these mathematics questions
-
The transportation department in your company is performing very badly. However, Top Management refuses to spend more money for new technologies because their budget is not big. What low-cost and...
-
The top five countries in wine consumption and their consumptions (in millions of gallons) are described by the three- dimensional graph in Fig. 133. a. What is confusing about the three-dimensional...
-
The following data were taken from Microsoft Corporations 2007 annual report. All dollar amounts are in millions. Required a. Compute Microsofts gross margin percentage for 2007 and 2006. b. Compute...
-
What are the costs of healthcare, where does the money come from, and where is it spent?
-
Smith loves dogs and has a pair of West Highland terriers. Jones has an incredible fear of dogs and cannot stand to be within sight of them. Smith and Jones are deciding whether to live in Arlington...
-
Which of the following situations represents a motivation, rather than an opportunity, to issue low-quality fi nancial reports? A . Poor internal controls B . Search for a personal bonus C ....
-
Im gathering some information about the sales/collection process and how it is supposed to work. Okay?
-
The adjusted trial balance of Cavamanlis Co. as of December 31, 2012, contains the following. Instructions(a) Prepare an income statement.(b) Prepare a statement of retained earnings.(c) Prepare a...
-
Superior has provided the following information for its recent year of operation: The common stock account balance at the beginning of the year was $20,000 and the year-end balance was $25,000. How...
-
SEC regulation, tax and working papers. Marshall and Wyatt, CPA, have been for several years the independent auditors of Interstate LDC Land Development Corporation of New Orleans, Louisiana. During...
-
What causes variation in drilling-mud resistivity? How does this variation complicate log analysis?
-
For each of the parts below, you want to withdraw $8,000 from an account at the end of 10 years. a. What single sum of money must you deposit today if the account earns 8 percent compound interest?...
-
Eight equal deposits of $1,000 are made at the end of each year into a fund paying 8 percent per year. a. What is the present worth 1 year before the first deposit? b. What is the future worth...
-
You take out a loan to buy a new audio system. Your equal annual payments are 20 percent of the amount you borrowed. The interest rate on the loan is 7 percent compounded annually. a. Determine the...
-
A small company wishes to setup a fund that can be used for technology purchases over thenext6years. Their forecast is for \($12\),000 to be needed at the end of year 1, decreasing by \($2\),000 each...
-
What uniform series over the interval [1,8] will be equivalent to a uniform series of $10,000 cash flows over the interval [3,10] based on a. a 6 percent annual compound interest rate? b. a 10...
-
According to the National Center for Health Statistics, in 1990, 28% of babies in the United States were born to parents who were not married. Throughout the 1990s, this increased by approximately...
-
Quality Chicken grows and processes chickens. Each chicken is disassembled into five main parts. Information pertaining to production in July 2012 is: Joint cost of production in July 2012 was $50. A...
-
Choose a well-known MNE and describe the kinds of power resources or bargaining chips it could use in FDI negotiations with a country government.
-
When thinking of Sony one typically thinks of the Walkman and music players, televisions and other home entertainment products including the Playstation; however over recent years the nature of many...
-
In the two decades to 2017, Chinas share of global merchandise exports almost tripled, rising from 4.7 per cent to 12.8 per cent. However, this trend did not reflect Chinas exports of rare earth...
-
Let \(Y\) be distributed according to the \(\operatorname{gamma}(265)\) distribution. (a) Find \(\mathrm{E}[Y]\). (b) Find \(\operatorname{Var}[Y]\). (c) Find \(P(Y>5)\)
-
In order to determine how e ective a magazine is at reaching its target audience, a market research company selects a random sample of people from the target audience and interviews them. Out of the...
-
Let \(Y\) be distributed according to the gamma(12 4) distribution. (a) Find \(\mathrm{E}[Y]\). (b) Find \(\operatorname{Var}[Y]\). (c) Find \(P(Y\)

Study smarter with the SolutionInn App