

Question: The normal quantile plot shown to the right represents duration times? (in seconds) of eruptions of a certain geyser from the accompanying data set. Examine
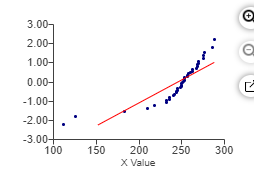
The normal quantile plot shown to the right represents duration times? (in seconds) of eruptions of a certain geyser from the accompanying data set. Examine the normal quantile plot and determine whether it depicts sample data from a population with a normal distribution.
Step by Step Solution
There are 3 Steps involved in it
1 Expert Approved Answer
Step: 1 Unlock

Question Has Been Solved by an Expert!
Get step-by-step solutions from verified subject matter experts
Step: 2 Unlock
Step: 3 Unlock