

Question: The normal quantile plot represents duration times (in seconds) of Old Faithful eruptions from Data Set 15 in Appendix B. Examine the normal quantile plot
The normal quantile plot represents duration times (in seconds) of Old Faithful eruptions from Data Set 15 in Appendix B.
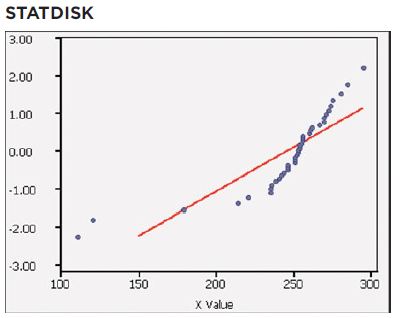
Examine the normal quantile plot and determine whether it depicts sample data from a population with a normal distribution.
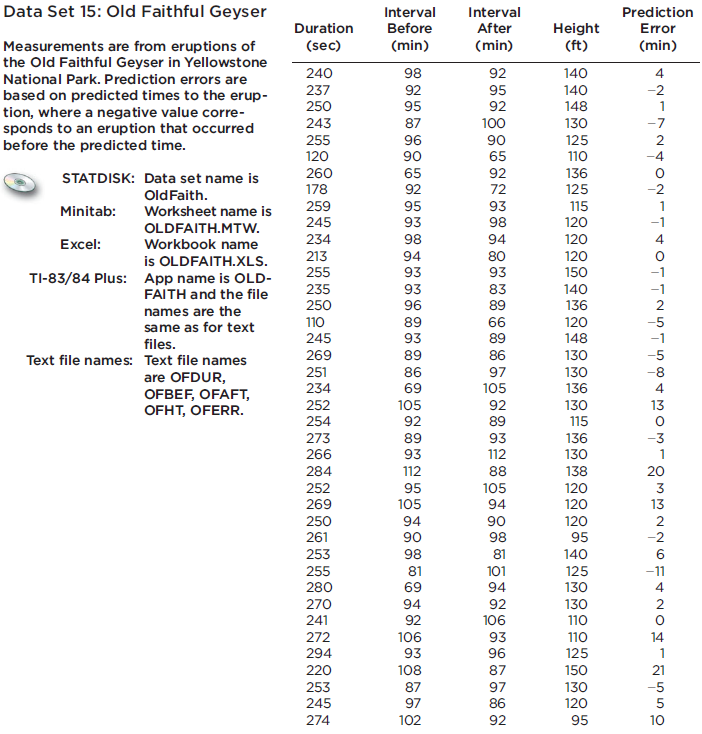
Data Set 15: Old Faithful Geyser Interval Interval Prediction Duration Before After Height (ft) Error (sec) (min) (min) (min) Measurements are from eruptions of the Old Faithful Geyser in Yellowstone National Park. Prediction errors are based on predicted times to the erup- tion, where a negative value corre- sponds to an eruption that occurred before the predicted time. 240 98 92 140 237 92 95 95 140 148 -2 250 92 243 87 100 130 -7 255 96 90 65 125 120 90 110 -4 260 178 136 125 STATDISK: Data set name is 65 92 92 72 -2 OldFaith. 259 95 93 Minitab: Worksheet name is 93 115 245 98 120 -1 OLDFAITH.MTw. Workbook name Excel: 234 98 94 120 213 255 94 80 is OLDFAITH.XLS. TI-83/84 Plus: App name is OLD- 120 150 93 93 -1 235 250 110 245 93 96 83 89 140 136 -1 FAITH and the file 2 names are the 89 66 89 120 -5 same as for text 93 148 -1 files. Text file names: Text file names 269 89 86 130 -5 251 86 69 97 130 136 -8 are OFDUR, OFBEF, OFAFT, OFHT, OFERR. 234 105 4 252 105 92 130 13 254 92 89 115 273 89 93 93 136 130 -3 266 112 284 112 95 88 138 20 252 105 94 120 3 269 105 120 250 261 90 98 94 120 95 2 90 -2 253 98 81 140 255 81 101 125 -11 280 69 94 130 4 270 241 94 92 130 92 106 93 106 110 272 93 110 125 14 294 220 96 108 87 150 21 253 87 97 130 120 -5 245 97 86 274 102 92 95 10
Step by Step Solution
3.50 Rating (167 Votes )
There are 3 Steps involved in it
A normal quantile plot also known as a QQ quantilequantile plot is a graphical tool to help assess if a data set is approximately normally distributed ... View full answer

Get step-by-step solutions from verified subject matter experts