

Question: The paired samples shown in the table below have been obtained from normally distributed populations. Sample # Population 1 Population 2 1 3,722 4,127
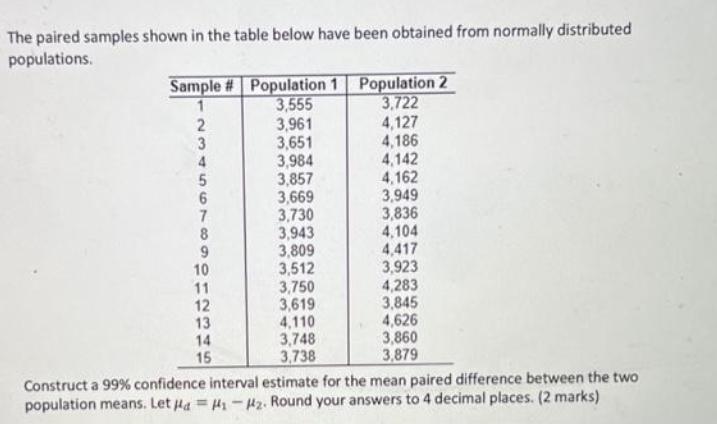
The paired samples shown in the table below have been obtained from normally distributed populations. Sample # Population 1 Population 2 1 3,722 4,127 4,186 2345 6 7 8 9 10 11 12 13 14 15 3,555 3,961 3,651 3,984 3,857 3,669 3,730 3,943 3,809 3,512 3,750 3,619 4,110 3,748 3,738 4,142 4,162 3,949 3,836 4,104 4,417 3,923 4,283 3,845 4,626 3,860 3,879 Construct a 99% confidence interval estimate for the mean paired difference between the two population means. Let Ha=H-H2. Round your answers to 4 decimal places. (2 marks)
Step by Step Solution
3.33 Rating (150 Votes )
There are 3 Steps involved in it
Given that 2955630718295... View full answer

Get step-by-step solutions from verified subject matter experts