

Question: The percentages in the table represent the performance change from the previous month. Consider the impact of each metric on customer questions. Metric Month 1
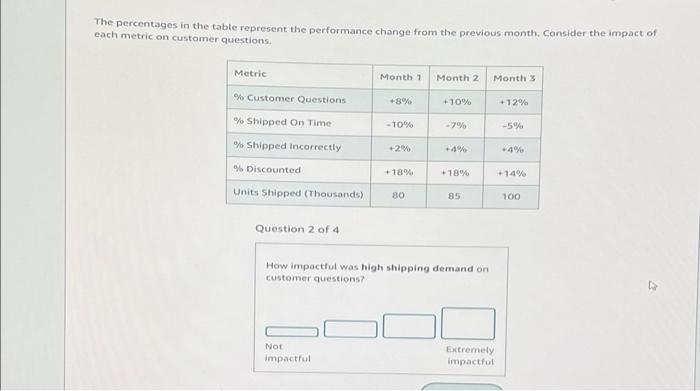
The percentages in the table represent the performance change from the previous month. Consider the impact of each metric on customer questions. Metric Month 1 Month 2 Month 3 % Customer Questions +8% +10% +12% % Shipped On Time -10% -7% -5% % Shipped incorrectly +2% +4% +4% % Discounted. +18% +18% +14% Units Shipped (Thousands) 80 85 100 Question 2 of 4 How impactful was high shipping demand on customer questions? Not impactful Extremely impactful
Step by Step Solution
There are 3 Steps involved in it
1 Expert Approved Answer
Step: 1 Unlock

Question Has Been Solved by an Expert!
Get step-by-step solutions from verified subject matter experts
Step: 2 Unlock
Step: 3 Unlock