

Question: The Perceptual Map tracks / plots product positioning for both High and Low Tech product offerings. What is the expected increase / decrease in Performance
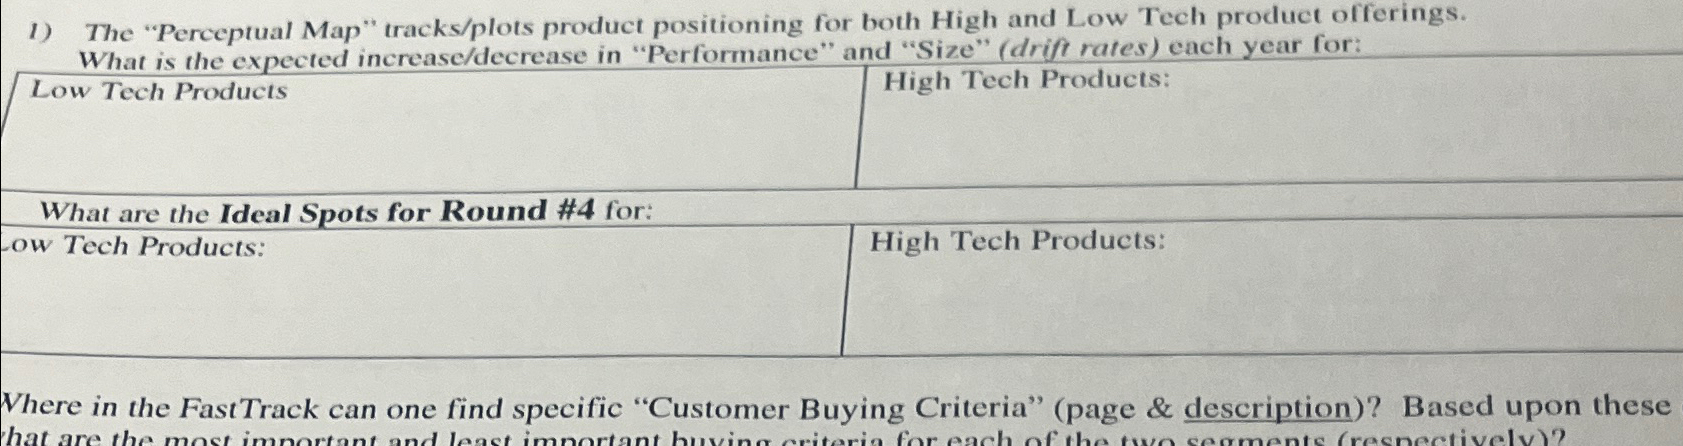
The "Perceptual Map" tracksplots product positioning for both High and Low Tech product offerings. What is the expected increasedecrease in "Performance" and "Size" drift rates each year for:
Low Tech Products
High Tech Products:
What are the Ideal Spots for Round # for:
ow Tech Products:
High Tech Products:
Where in the FastTrack can one find specific "Customer Buying Criteria" page & description Based upon these
Step by Step Solution
There are 3 Steps involved in it
1 Expert Approved Answer
Step: 1 Unlock

Question Has Been Solved by an Expert!
Get step-by-step solutions from verified subject matter experts
Step: 2 Unlock
Step: 3 Unlock