

Question: The picture below shows the histogram generated from a number of Monte Carlo runs for the value of a portfolio, in millions of dollars: Using
The picture below shows the histogram generated from a number of Monte Carlo runs for the value of a portfolio, in millions of dollars:
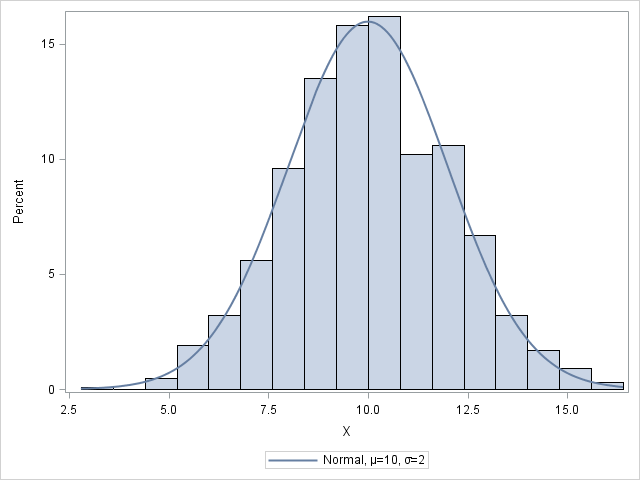
Using the data depicted in the image, calculate the 95% VaR.
(Hint: you can assume that the value of the portfolio follows a certain distribution...)
Step by Step Solution
There are 3 Steps involved in it
1 Expert Approved Answer
Step: 1 Unlock

Question Has Been Solved by an Expert!
Get step-by-step solutions from verified subject matter experts
Step: 2 Unlock
Step: 3 Unlock