

Question: The plot given below shows P-T curves (where P is the pressure and T is the temperature) for two solvents X and Y and
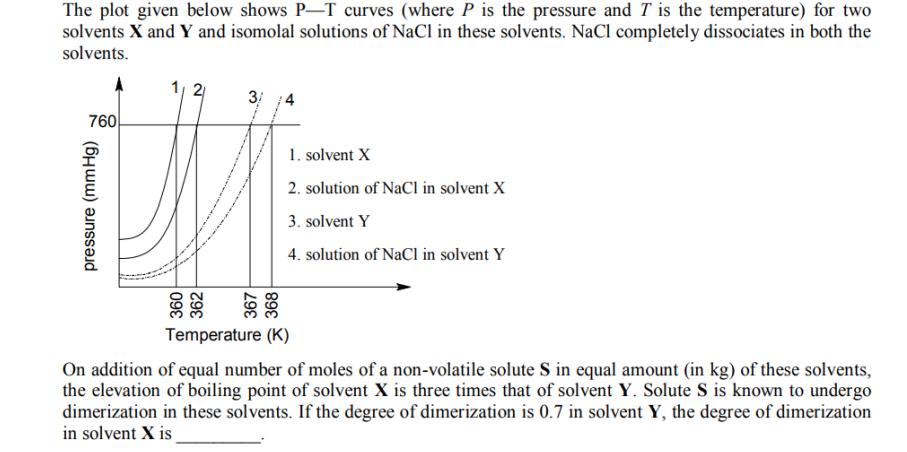
The plot given below shows P-T curves (where P is the pressure and T is the temperature) for two solvents X and Y and isomolal solutions of NaCl in these solvents. NaCl completely dissociates in both the solvents. 760 pressure (mmHg) 1, 2 360 362 3/ 4 367 368 1. solvent X 2. solution of NaCl in solvent X 3. solvent Y 4. solution of NaCl in solvent Y Temperature (K) On addition of equal number of moles of a non-volatile solute S in equal amount (in kg) of these solvents, the elevation of boiling point of solvent X is three times that of solvent Y. Solute S is known to undergo dimerization in these solvents. If the degree of dimerization is 0.7 in solvent Y, the degree of dimerization in solvent X is
Step by Step Solution
3.50 Rating (163 Votes )
There are 3 Steps involved in it
The detailed ... View full answer

Get step-by-step solutions from verified subject matter experts