

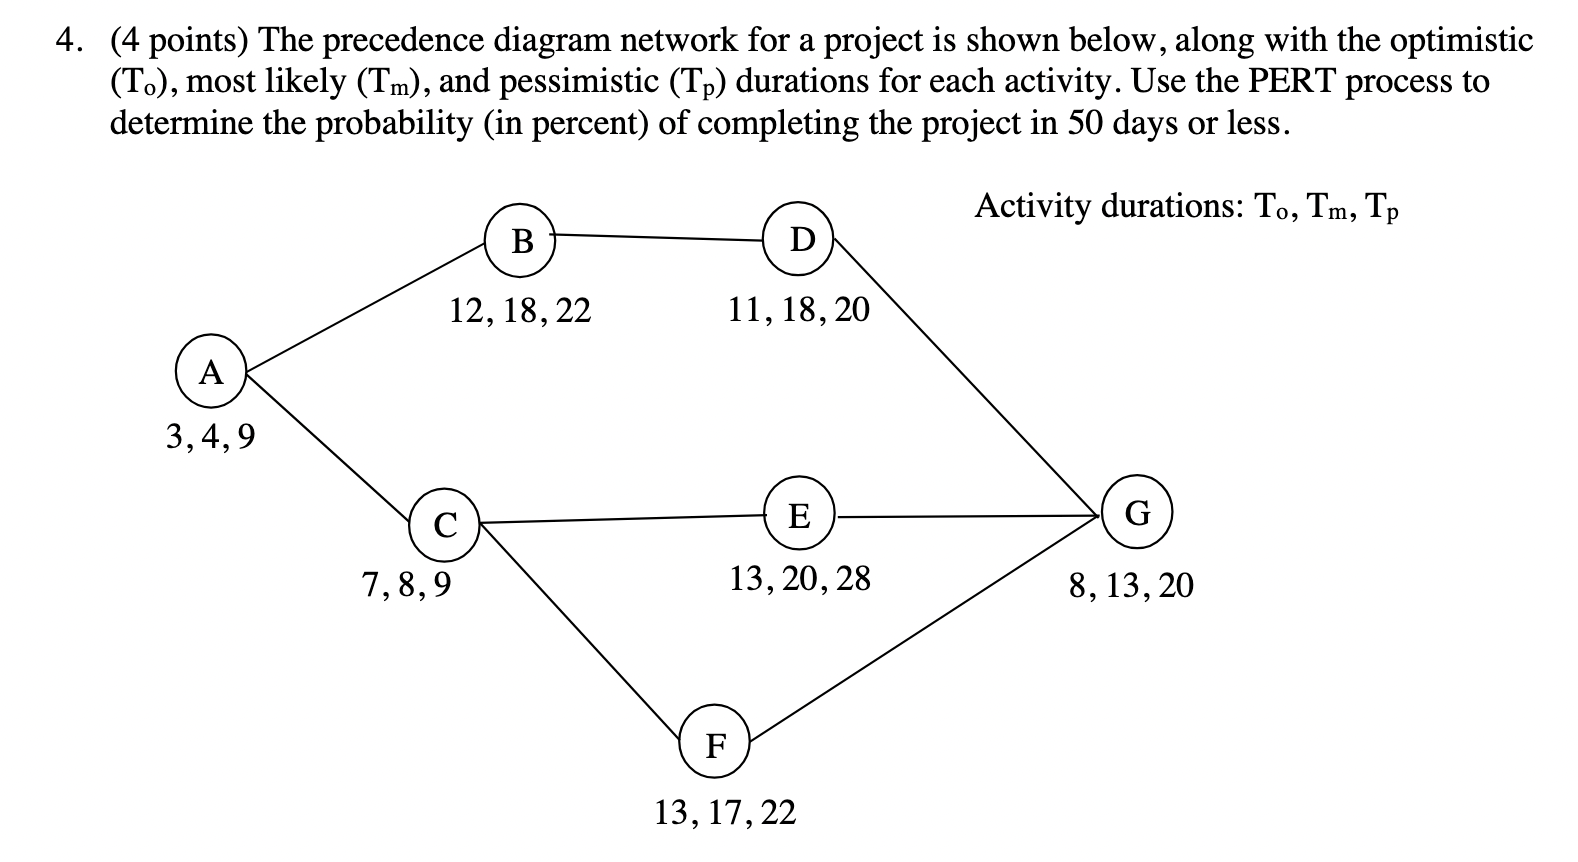
Question: The precedence diagram network for a project is shown below, along with the optimistic ( To ) , most likely ( Tm ) , and
The precedence diagram network for a project is shown below, along with the optimistic
To most likely Tm and pessimistic Tp durations for each activity. Use the PERT process to
determine the probability in percent of completing the project in days or less.
Step by Step Solution
There are 3 Steps involved in it
1 Expert Approved Answer
Step: 1 Unlock

Question Has Been Solved by an Expert!
Get step-by-step solutions from verified subject matter experts
Step: 2 Unlock
Step: 3 Unlock