

Question: The probability distribution of a random variable X is given in. the following table: -3 0 1 2 P(X=x) 0.1 0.1 0.3 0.5 a.
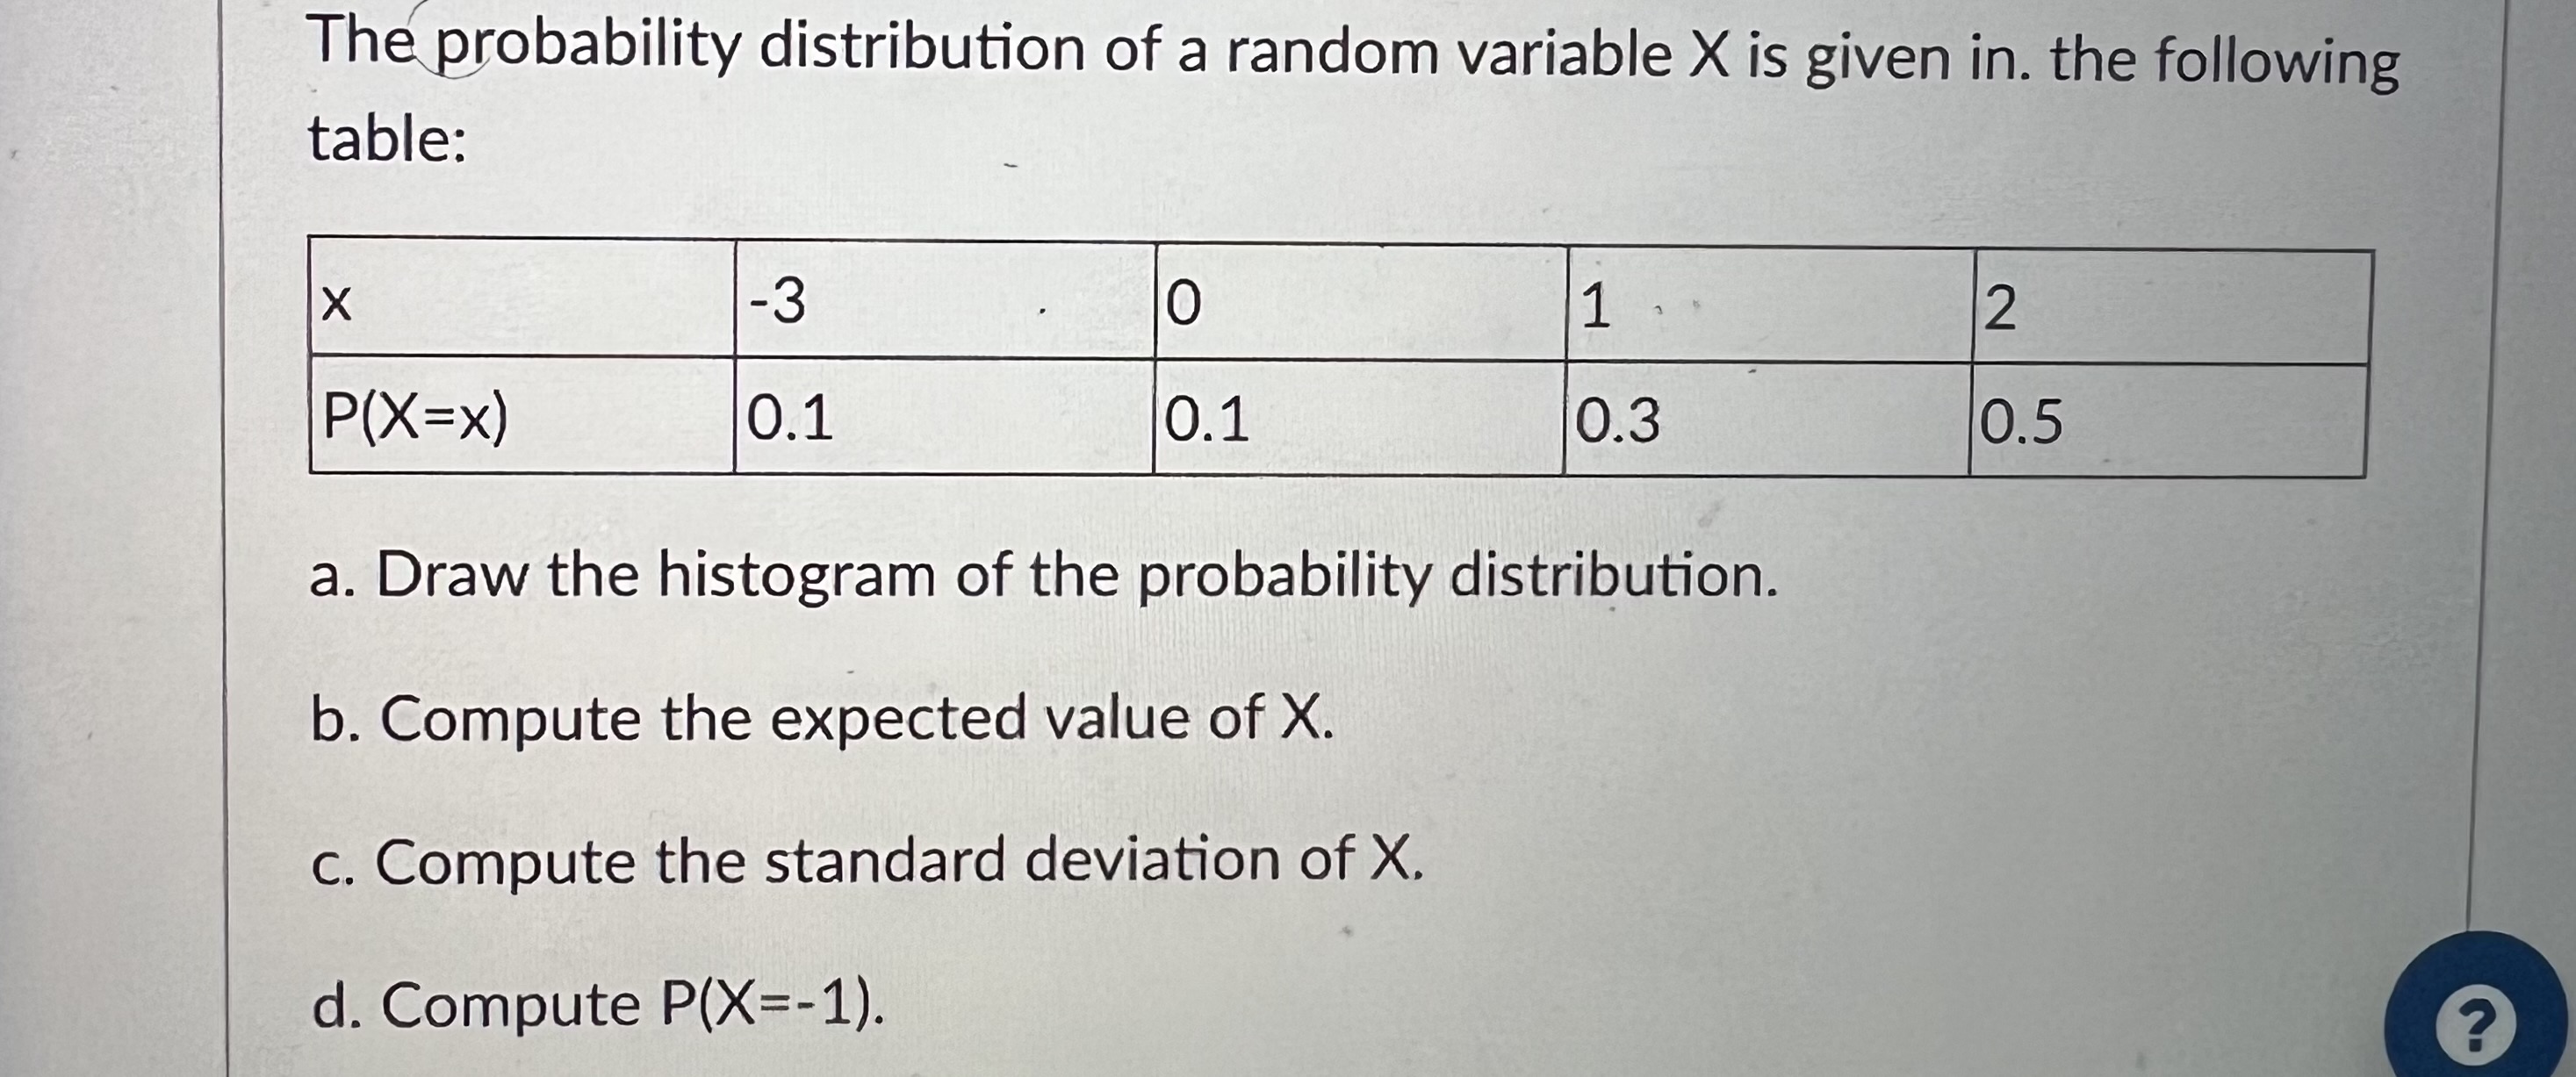
The probability distribution of a random variable X is given in. the following table: -3 0 1 2 P(X=x) 0.1 0.1 0.3 0.5 a. Draw the histogram of the probability distribution. b. Compute the expected value of X. c. Compute the standard deviation of X. d. Compute P(X=-1). ?
Step by Step Solution
There are 3 Steps involved in it
1 Expert Approved Answer
Step: 1 Unlock

Question Has Been Solved by an Expert!
Get step-by-step solutions from verified subject matter experts
Step: 2 Unlock
Step: 3 Unlock