

Question: The problem statement says to plot the percent difference for the first five eigenvalues. Please plot the percent difference for * all * of the
The problem statement says to plot the percent difference for the first five eigenvalues. Please plot the percent difference for *all* of the eigenvalues.
And please use Matlab to solve the question. Thanks.
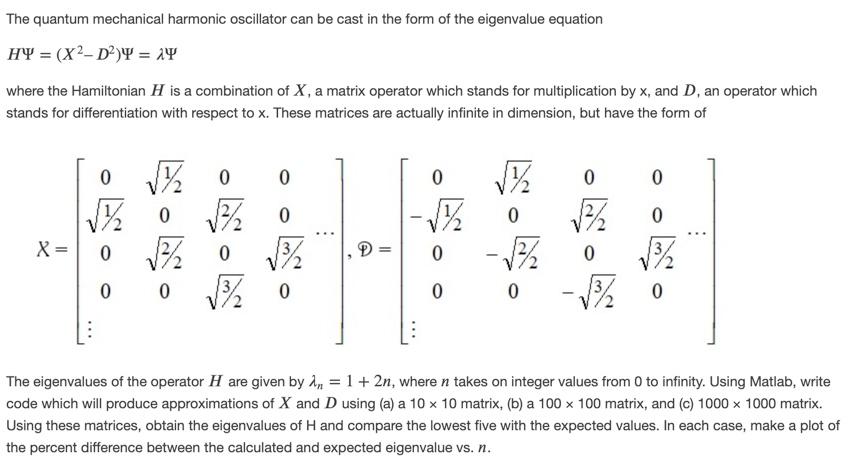
The quantum mechanical harmonic oscillator can be cast in the form of the eigenvalue equation HY = (X2-D2)* = 24 where the Hamiltonian H is a combination of X, a matrix operator which stands for multiplication by x, and D, an operator which stands for differentiation with respect to x. These matrices are actually infinite in dimension, but have the form of 0 0 0 0 0 0 0 0 - 0 (% 22 172 0 X= 0 0 (% 0 122 0 0 0 0 0 0 0 The eigenvalues of the operator H are given by n = 1+ 2n, where n takes on integer values from 0 to infinity. Using Matlab, write code which will produce approximations of X and D using (a) a 10 x 10 matrix, (b) a 100 x 100 matrix, and (c) 1000 x 1000 matrix. Using these matrices, obtain the eigenvalues of H and compare the lowest five with the expected values. In each case, make a plot of the percent difference between the calculated and expected eigenvalue vs. n. The quantum mechanical harmonic oscillator can be cast in the form of the eigenvalue equation HY = (X2-D2)* = 24 where the Hamiltonian H is a combination of X, a matrix operator which stands for multiplication by x, and D, an operator which stands for differentiation with respect to x. These matrices are actually infinite in dimension, but have the form of 0 0 0 0 0 0 0 0 - 0 (% 22 172 0 X= 0 0 (% 0 122 0 0 0 0 0 0 0 The eigenvalues of the operator H are given by n = 1+ 2n, where n takes on integer values from 0 to infinity. Using Matlab, write code which will produce approximations of X and D using (a) a 10 x 10 matrix, (b) a 100 x 100 matrix, and (c) 1000 x 1000 matrix. Using these matrices, obtain the eigenvalues of H and compare the lowest five with the expected values. In each case, make a plot of the percent difference between the calculated and expected eigenvalue vs. n
Step by Step Solution
There are 3 Steps involved in it

Get step-by-step solutions from verified subject matter experts