

Question: The project assigned per grading matrix aims at introducing the students to the concept of using excel in practical applications pertaining to ships performance curves.
The project assigned per grading matrix aims at introducing the students to the concept of using excel in practical applications pertaining to ships performance curves. Moreover, the project assesses the students understanding and skills in solving practical problems in operational research. The project is comprised of two major problems as below. For each problem the student is required to:
1) Explain how he/she reached the solution what method(s) were used.
2) Present their results
3) Comment on their results.
Deliverables for the project are the following:
1) Report containing brief introduction on the problems, the solution, description on how the solution was obtained (Mark Assigned 12.5%).
2) Original excel files solution(s) for each problem (Mark Assigned 12.5%).
Problems:
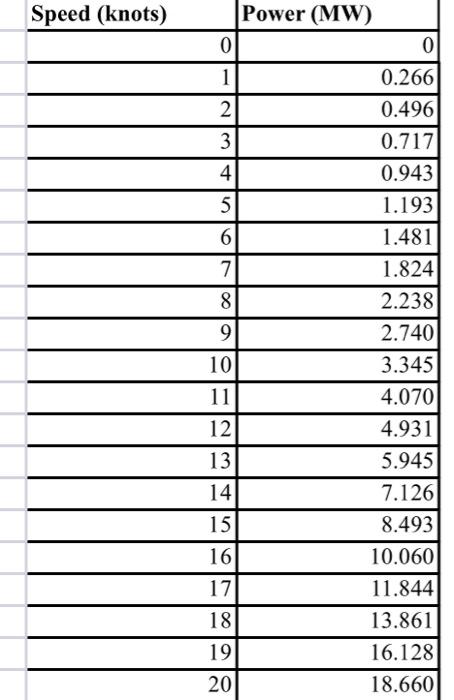
Problem 1: Ship Rated Power vs. Speed tables provides the required power a ship consumes to reach and maintain a fixed speed. Data available in EXCEL (Speed Vs Power 2022.excl) shows the ship power vs. speed data. Do the following:
a) Graph the data using excel and add the appropriate titles.
b) Determine the best data fit using a linear trendline and a polynomial trendline. Justify your choices.
c) Using linear interpolation determine the ship power at the following speed: 9.5 knots
d) Use extrapolation methods to determine the ship speed at a power rating of: 22 MW.
e) For the ship power vs. speed data sets, determine using numerical tools the integrals of the speed vs. power between 4 knots to 14 knots.
Step by Step Solution
There are 3 Steps involved in it

Get step-by-step solutions from verified subject matter experts