

Question: The project assigned per DSMD - 1 0 0 grading matrix aims at introducing the students to the concept of using excel in practical applications
The project assigned per DSMD grading matrix aims at introducing the students to the concept of using excel in practical applications pertaining to ship's performance curves. Moreover, the project assesses the student's understanding and skills in solving practical problems in operational research. The project is comprised of twa major problems as below. The problems are to be solved in groups comprised of no more than TWO students. For each problem the student is required to:
Explain how heshe reached the solution what methods were used.
Present their results
Comment an their results.
Deliverables for the project are the following:
Presentation containing brief introduction an the problems, the solution, description on how the solution was obtained Mark Assigned
Original excel files solutions for each problem Mark Assigned
By EOB of February the presentation and the excel files must be submitted.
Problems:
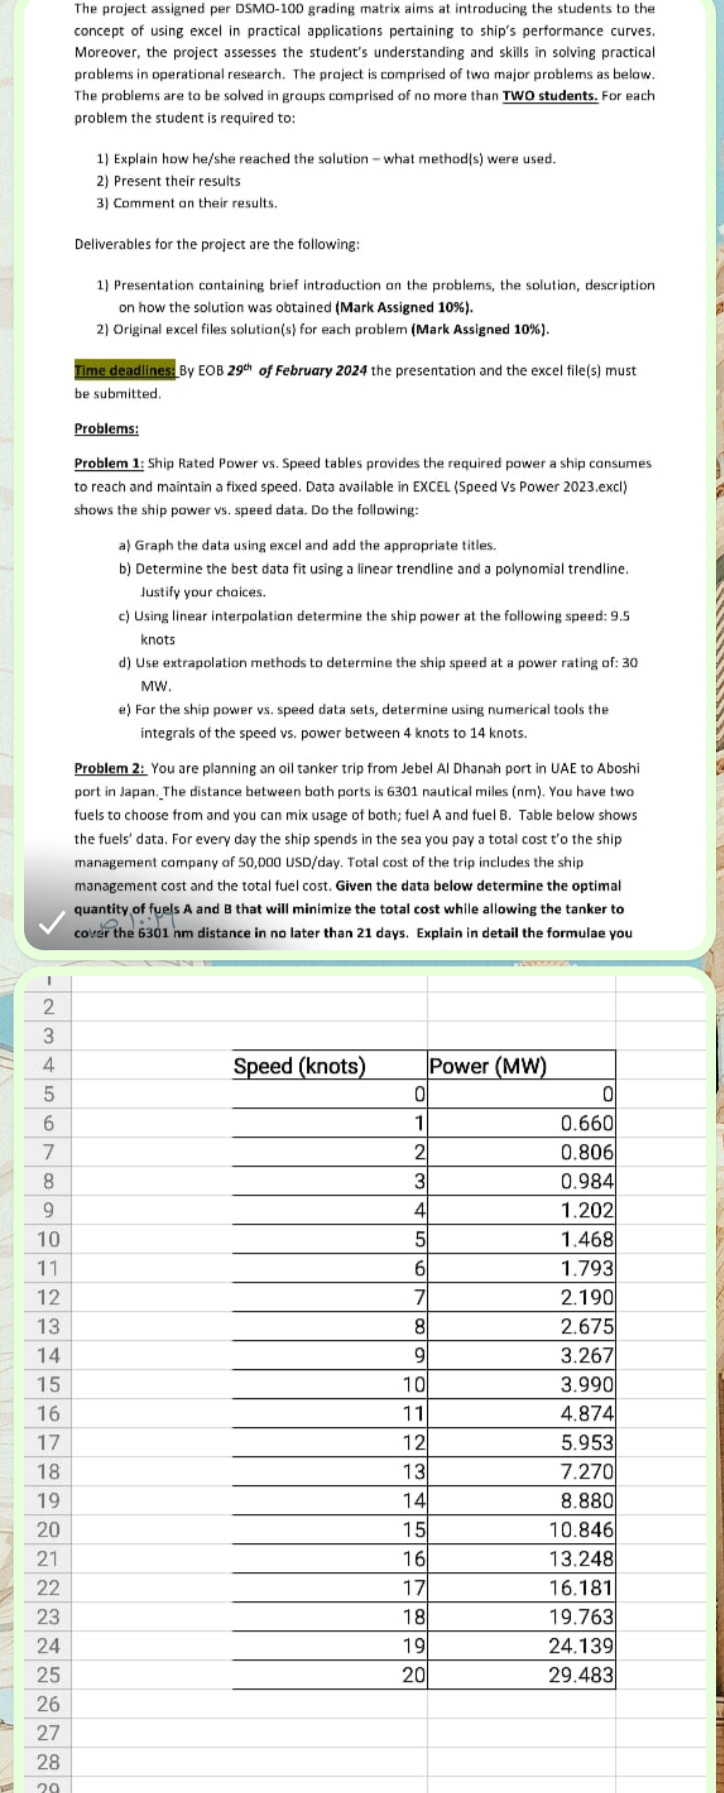
Problem : Ship Rated Power vs Speed tables provides the required power a ship consumes to reach and maintain a fixed speed. Data available in EXCEL Speed Vs Power excl shows the ship power vs speed data. Do the following:
a Graph the data using excel and add the appropriate titles.
b Determine the best data fit using a linear trendline and a polynomial trendline. Justify your chaices.
c Using linear interpolation determine the ship power at the following speed: knots
d Use extrapolation methods to determine the ship speed at a power rating of: MW
e For the ship power vs speed data sets, determine using numerical tools the integrals of the speed vs power between knots to knots.
Problem : You are planning an oil tanker trip from Jebel Al Dhanah port in UAE to Aboshi port in Japan.The distance between both ports is nautical miles nm You have two fuels to choose from and you can mix usage of both; fuel A and fuel B Table below show the fuels' data. For every day the ship spends in the sea you pay a total cost to the ship management company of D USDday Total cost of the trip includes the ship management cost and the total fuel cost. Given the data below determine the optimal quantity of fyels A and that will minimize the total cost while allowing the tanker to cover the distance in no later than days. Explain in detail the formulae you
tableSpeed knotsPower MW
Step by Step Solution
There are 3 Steps involved in it
1 Expert Approved Answer
Step: 1 Unlock

Question Has Been Solved by an Expert!
Get step-by-step solutions from verified subject matter experts
Step: 2 Unlock
Step: 3 Unlock