

Question: the question is in the second pic. the first pic is information to solve the first pic . pls show working. Scenario 1: A local
the question is in the second pic. the first pic is information to solve the first pic . pls show working. 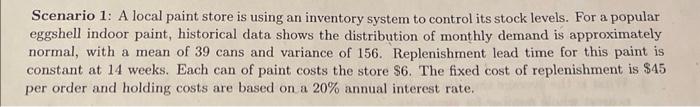
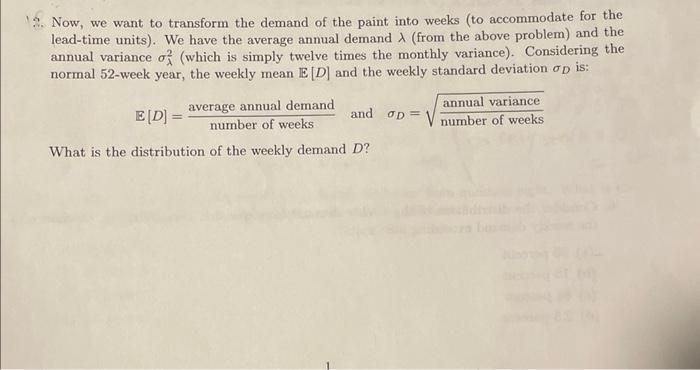
Scenario 1: A local paint store is using an inventory system to control its stock levels. For a popular eggshell indoor paint, historical data shows the distribution of monthly demand is approximately normal, with a mean of 39 cans and variance of 156. Replenishment lead time for this paint is constant at 14 weeks. Each can of paint costs the store \$6. The fixed cost of replenishment is \$45 per order and holding costs are based on a 20% annual interest rate. Now, we want to transform the demand of the paint into weeks (to accommodate for the lead-time units). We have the average annual demand (from the above problem) and the annual variance 2 (which is simply twelve times the monthly variance). Considering the normal 52 -week year, the weekly mean E[D] and the weekly standard deviation D is: E[D]=numberofweeksaverageannualdemandandD=numberofweeksannualvariance What is the distribution of the weekly demand D
Step by Step Solution
There are 3 Steps involved in it
1 Expert Approved Answer
Step: 1 Unlock

Question Has Been Solved by an Expert!
Get step-by-step solutions from verified subject matter experts
Step: 2 Unlock
Step: 3 Unlock