

Question: The random sample will be drawn from a CSV file. This data will be unique to you, and therefore your answers will be unique
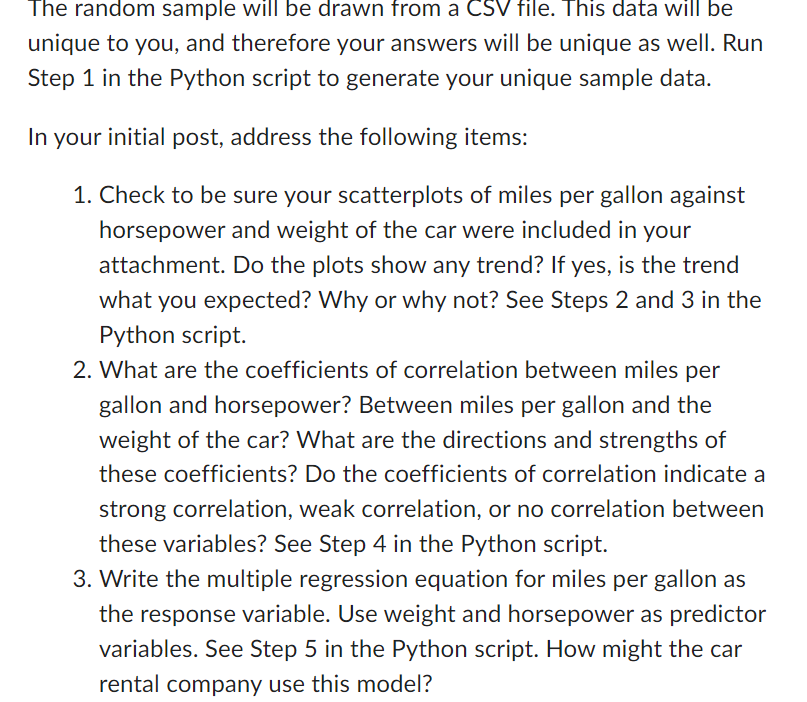
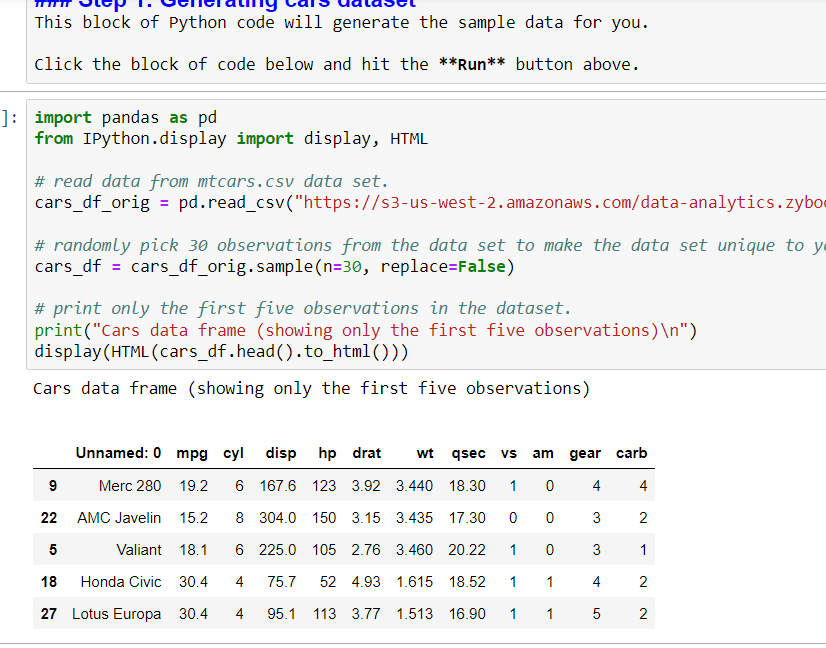
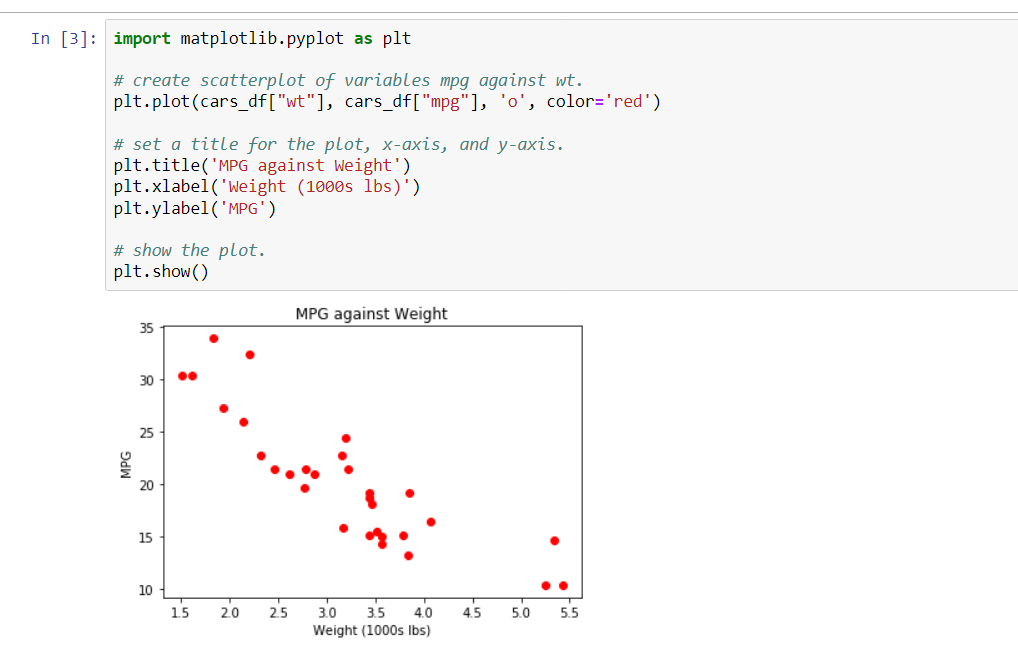
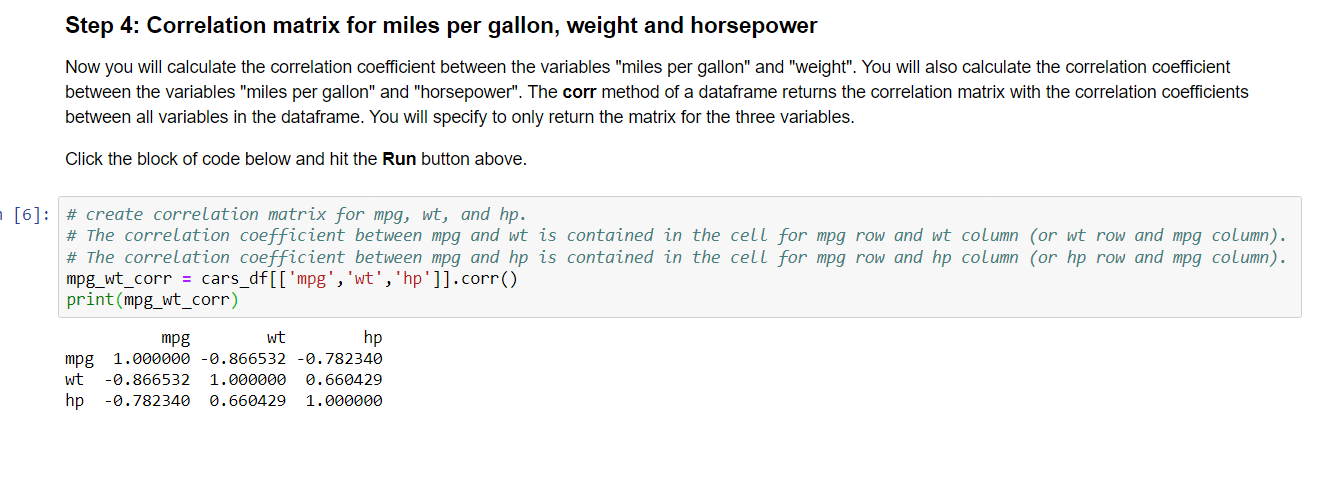
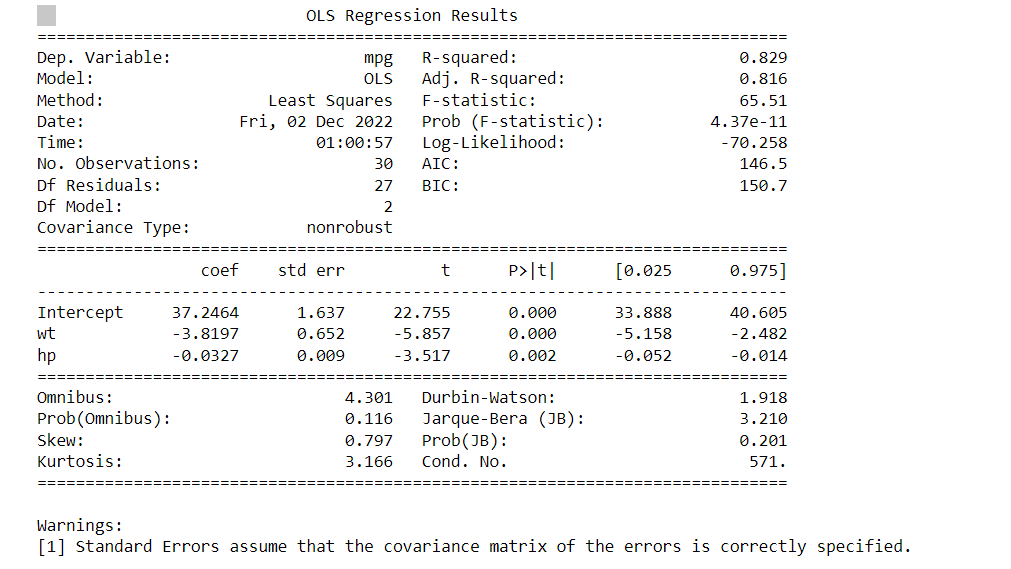
The random sample will be drawn from a CSV file. This data will be unique to you, and therefore your answers will be unique as well. Run Step 1 in the Python script to generate your unique sample data. In your initial post, address the following items: 1. Check to be sure your scatterplots of miles per gallon against horsepower and weight of the car were included in your attachment. Do the plots show any trend? If yes, is the trend what you expected? Why or why not? See Steps 2 and 3 in the Python script. 2. What are the coefficients of correlation between miles per gallon and horsepower? Between miles per gallon and the weight of the car? What are the directions and strengths of these coefficients? Do the coefficients of correlation indicate a strong correlation, weak correlation, or no correlation between these variables? See Step 4 in the Python script. 3. Write the multiple regression equation for miles per gallon as the response variable. Use weight and horsepower as predictor variables. See Step 5 in the Python script. How might the car rental company use this model? This block of Python code will generate the sample data for you. click the block of code below and hit the **Run** button above. ] import pandas as pd from IPython.display import display, HTML # read data from mtcars.csv data set. cars_df_orig = pd.read_csv("https://s3-us-west-2.amazonaws.com/data-analytics.zybo # randomly pick 30 observations from the data set to make the data set unique to y cars_df = cars_df_orig.sample(n=30, replace=False) # print only the first five observations in the dataset. print("Cars data frame (showing only the first five observations) ") display (HTML (cars_df.head().to_html())) Cars data frame (showing only the first five observations) Unnamed: 0 mpg cyl disp hp drat wt qsec vs am gear carb 9 Merc 280 19.2 6 167.6 123 3.92 3.440 18.30 1 0 4 4 22 AMC Javelin 15.2 8 304.0 150 3.15 3.435 17.30 0 0 3 2 5 Valiant 18.1 6 225.0 105 2.76 3.460 20.22 1 0 3 1 18 Honda Civic 30.4 4 75.7 52 4.93 1.615 18.52 1 1 4 2 27 Lotus Europa 30.4 4 95.1 113 3.77 1.513 16.90 1 1 5 2 In [3] import matplotlib.pyplot as plt # create scatterplot of variables mpg against wt. plt.plot(cars_df["wt"], cars_df["mpg"], 'o', color='red') # set a title for the plot, x-axis, and y-axis. plt.title('MPG against Weight') plt.xlabel('Weight (1000s lbs)') plt.ylabel('MPG') # show the plot. plt.show() MPG against Weight MPG 15 20 30 35 10 15 2.0 2.5 3.0 3.5 4.0 4.5 5.0 5.5 Weight (1000s lbs) In [4] import matplotlib.pyplot as plt # create scatterplot of variables mpg against hp. plt.plot(cars_df["hp"], cars_df["mpg"], 'o', color='blue') # set a title for the plot, x-axis, and y-axis. plt.title('MPG against Horsepower') plt.xlabel('Horsepower') plt.ylabel('MPG') # show the plot. plt.show() MPG against Horsepower 35 30 30 MPG 25 20 20 15 10 150 50 100 150 200 250 300 Step 4: Correlation matrix for miles per gallon, weight and horsepower Now you will calculate the correlation coefficient between the variables "miles per gallon" and "weight". You will also calculate the correlation coefficient between the variables "miles per gallon" and "horsepower". The corr method of a dataframe returns the correlation matrix with the correlation coefficients between all variables in the dataframe. You will specify to only return the matrix for the three variables. Click the block of code below and hit the Run button above. [6]: # create correlation matrix for mpg, wt, and hp. # The correlation coefficient between mpg and wt is contained in the cell for mpg row and wt column (or wt row and mpg column). # The correlation coefficient between mpg and hp is contained in the cell for mpg row and hp column (or hp row and mpg column). mpg_wt_corrcars_df[['mpg', 'wt', 'hp']].corr() print (mpg_wt_corr) mpg wt hp mpg 1.000000 -0.866532 -0.782340 wt -0.866532 1.000000 0.660429 hp -0.782340 0.660429 1.000000 Dep. Variable: mpg OLS Regression Results R-squared: ==== 0.829 Model: OLS Adj. R-squared: 0.816 Method: Least Squares F-statistic: 65.51 Date: Fri, 02 Dec 2022 Prob (F-statistic): 4.37e-11 Time: 01:00:57 Log-Likelihood: -70.258 No. Observations: 30 AIC: 146.5 Df Residuals: 27 BIC: 150.7 Df Model: 2 Covariance Type: nonrobust coef std err t P>|t| [0.025 0.975] Intercept 37.2464 1.637 22.755 0.000 33.888 40.605 wt -3.8197 0.652 -5.857 0.000 -5.158 -2.482 hp -0.0327 0.009 -3.517 0.002 -0.052 -0.014 Omnibus: 4.301 Durbin-Watson: Prob(Omnibus): 0.116 Jarque-Bera (JB): Skew: 0.797 Prob(JB): Kurtosis: 3.166 Cond. No. 1.918 3.210 0.201 571. Warnings: [1] Standard Errors assume that the covariance matrix of the errors is correctly specified.
Step by Step Solution
There are 3 Steps involved in it

Get step-by-step solutions from verified subject matter experts