

Question: the sample size is not 35 using P chart for this problem B Table 1: Red M&M and all samples Sample # # of M&M
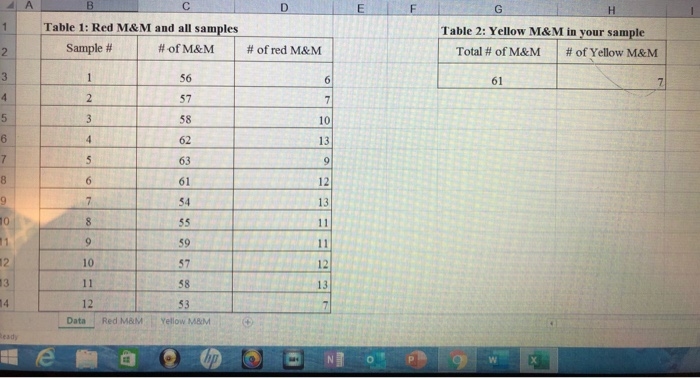
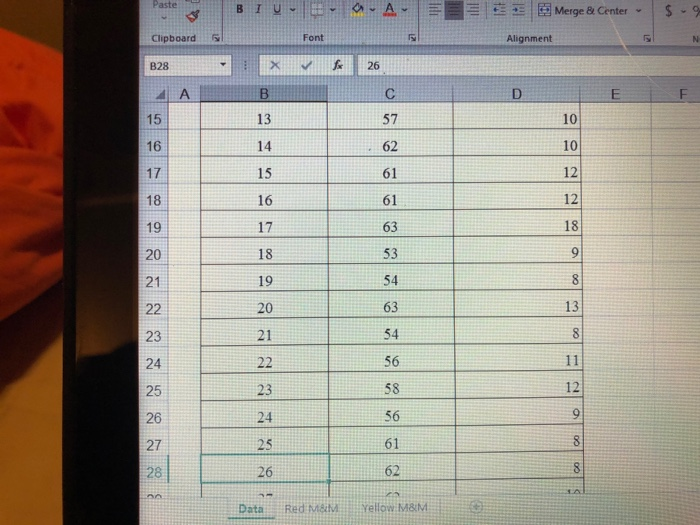
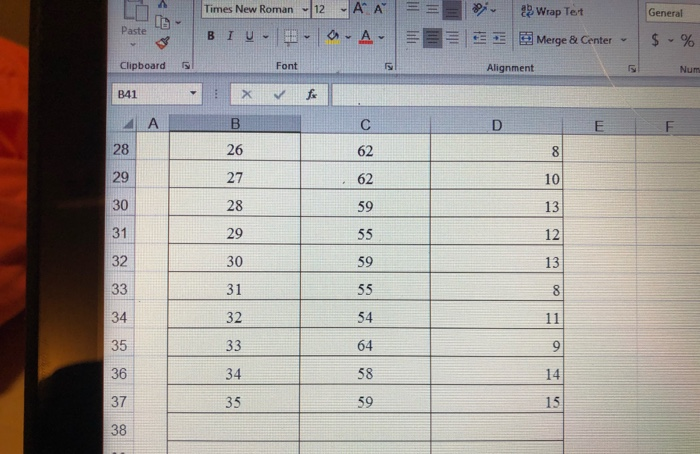
the sample size is not 35
using P chart for this problem
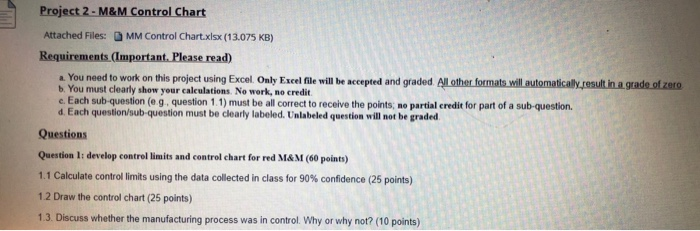
B Table 1: Red M&M and all samples Sample # # of M&M Table 2: Yellow M&M in your sample Total # of M&M # of Yellow M&M # of red M&M 12 53 Data Red M&M Yellow MM Paste BIU Merge & Center - $ - Clipboard Font Alignment IN B28 26 DET .Coco Data Red Yellow M&M Times New Roman 12 2 Wrap Tet Merge & Center - General $ - % Paste BIU- - Clipboard Font Alignment Nun B41 X C D E 62 10 13 12 13 S 55 54 11 64 58 59 Project 2 - M&M Control Chart Attached Files: MM Control Chart.xlsx (13.075 KB) Requirements (Important. Please read) You need to work on this project using Excel Only Excel file will be accepted and graded. All other formats will automatically result in a grade of zero b. You must clearly show your calculations. No work, no credit c. Each sub question (eg. question 1.1) must be all correct to receive the points de partial credit for part of a sub-question. d. Each question/sub-question must be clearly labeled. Unlabeled question will not be graded Questions Question 1: develop control limits and control chart for red M&M (60 points) ulate control limits using the data collected in class for 90% confidence (25 points) 12 Draw the control chart (25 points) 1.3. Discuss whether the manufacturing process was in control. Why or why not? (10 points)
Step by Step Solution
There are 3 Steps involved in it
1 Expert Approved Answer
Step: 1 Unlock

Question Has Been Solved by an Expert!
Get step-by-step solutions from verified subject matter experts
Step: 2 Unlock
Step: 3 Unlock