

Question: The scatter chart indicates there may be a negative linear relationship between DJIA and S&P 500. The scatter chart indicates there may be a positive
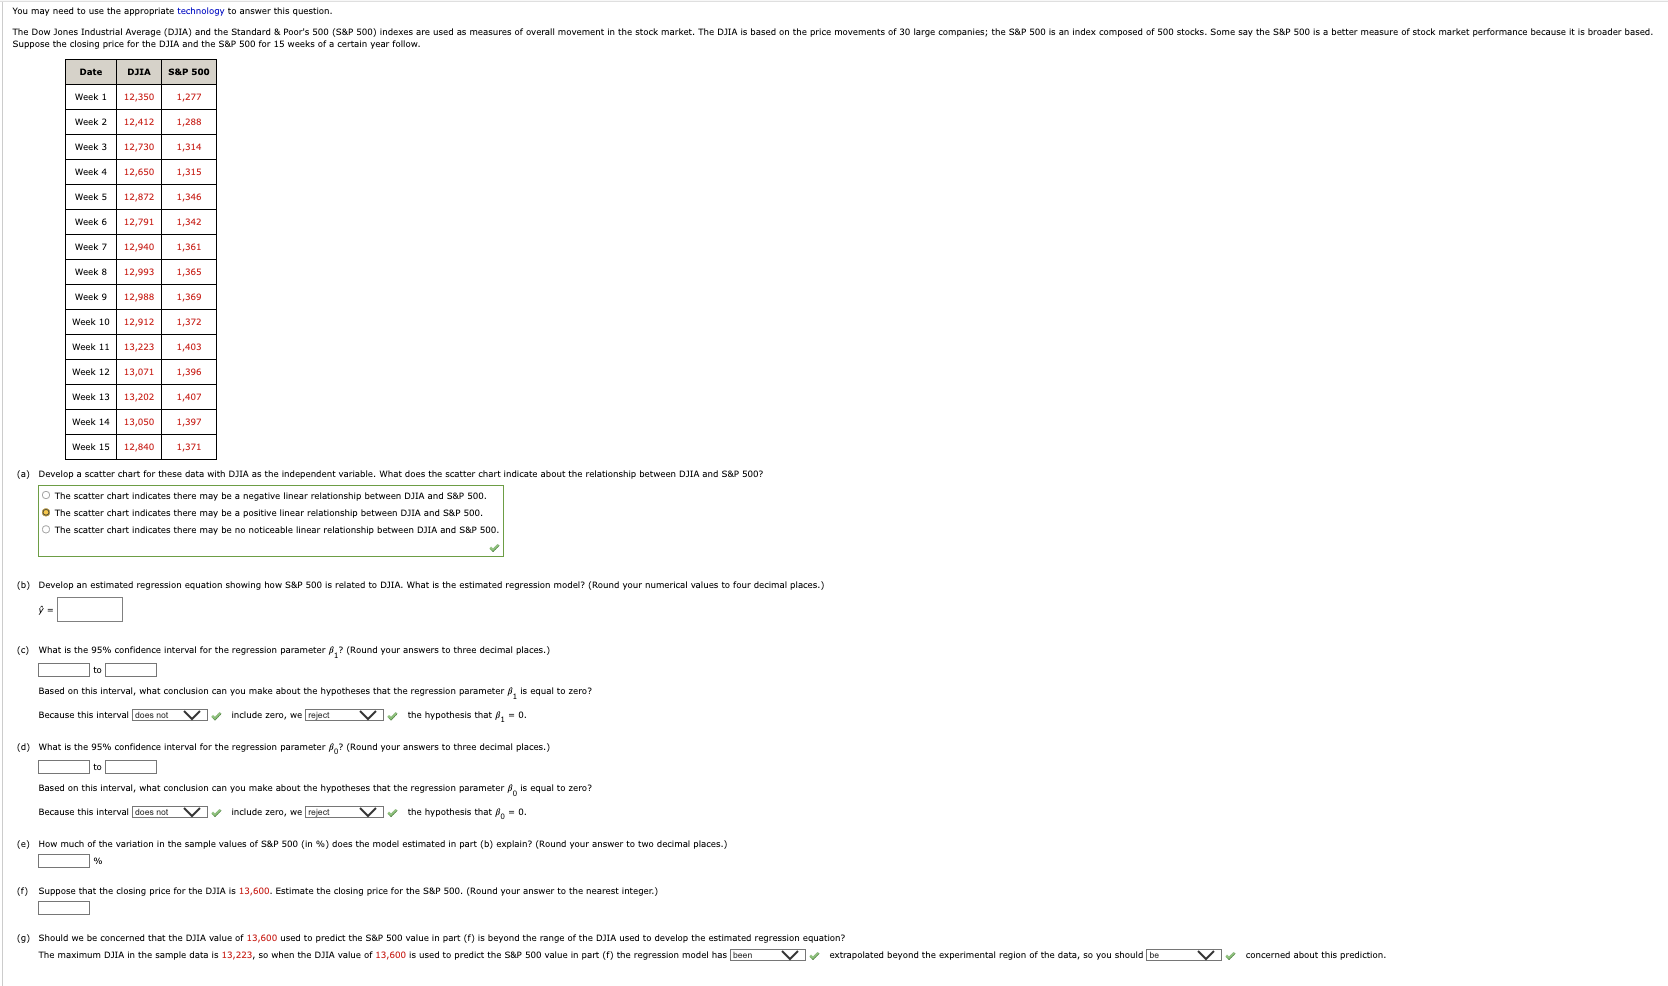
The scatter chart indicates there may be a negative linear relationship between DJIA and S\&P 500. The scatter chart indicates there may be a positive linear relationship between DJIA and S\&P 500. The scatter chart indicates there may be no noticeable linear relationship between DJIA and S\&P 500
Step by Step Solution
There are 3 Steps involved in it
1 Expert Approved Answer
Step: 1 Unlock

Question Has Been Solved by an Expert!
Get step-by-step solutions from verified subject matter experts
Step: 2 Unlock
Step: 3 Unlock